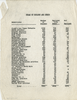
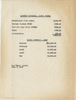
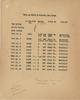
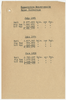
charts (graphic documents)
A tabular or graphic representation of a fluctuating or dependent variable, such as magnitude, temperature, cost, etc.
A tabular or graphic representation of a fluctuating or dependent variable, such as magnitude, temperature, cost, etc.