Search the Special Collections and Archives Portal
Search Results

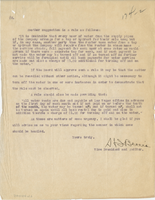
Letter to W. H. Comstock (Los Angeles), May 25, 1920
Date
Archival Collection
Description
Letter probably from J. Ross Clark expressing skepticism that repairing the line will increase pressure. He was also wary of purchasing a well from someone else.
Text
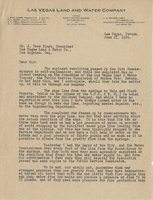
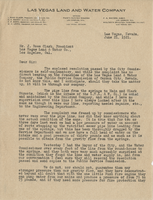
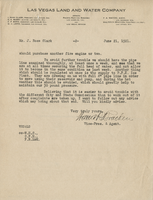
Letter from Walter R. Bracken (Las Vegas) to J. Ross Clark (Los Angeles), June 21, 1921
Date
Archival Collection
Description
Bracken appraising Clark of a complaint by the City Commission to the Nevada Public Service Commission and its resolution.
Text
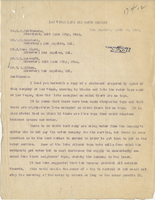
Letter from H. I. Bettis (Los Angeles) to C. O. Whittemore (Salt Lake City), W. H. Comstock (Los Angeles), J. Ross Clark (Los Angeles), W. H. Bancroft (Salt Lake City), and T. E. Gibbon (Los Angeles), April 12, 1906
Date
Archival Collection
Description
There were more lots in Las Vegas occupied than paid water connections, and the letter discusses the best method to get unauthorized users to pay.
Text
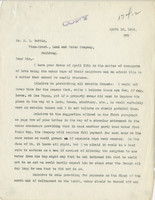
Letter to H. I. Bettis, April 13, 1906
Date
Archival Collection
Description
Bettis stating that prohibiting outside faucets would not solve the problem of unauthorized users, and would punish those who haven't given permission to neighbors who were using it anyway. It was also hard for owners to stand guard over their taps.
Text

