Copyright & Fair-use Agreement
UNLV Special Collections provides copies of materials to facilitate private study, scholarship, or research. Material not in the public domain may be used according to fair use of copyrighted materials as defined by copyright law. Please cite us.
Please note that UNLV may not own the copyright to these materials and cannot provide permission to publish or distribute materials when UNLV is not the copyright holder. The user is solely responsible for determining the copyright status of materials and obtaining permission to use material from the copyright holder and for determining whether any permissions relating to any other rights are necessary for the intended use, and for obtaining all required permissions beyond that allowed by fair use.
Read more about our reproduction and use policy.
I agree.Information
Digital ID
Permalink
Details
More Info
Rights
Digital Provenance
Publisher
Transcription
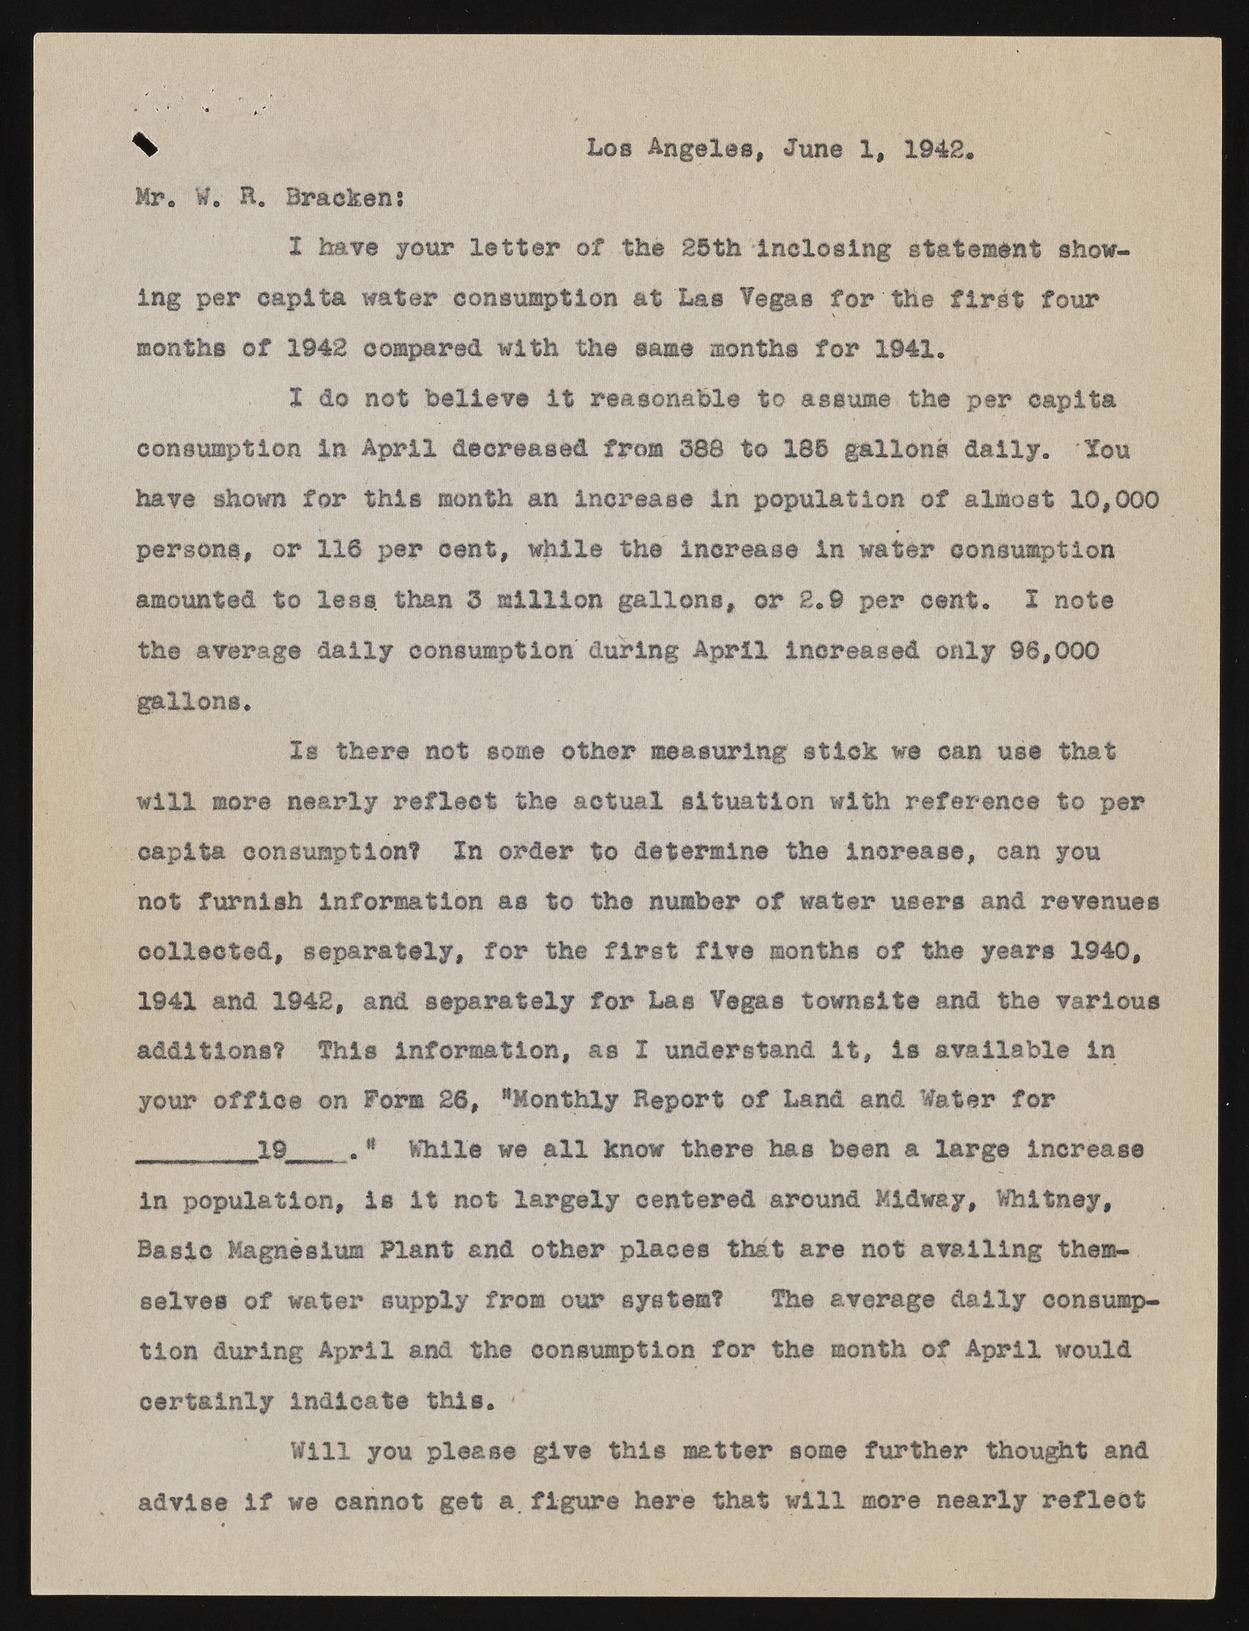
\ 1*08 Angeles, June 1, 1942. Mr. W. R. Bracken: I have your letter of the 25th inclosing statement showing per capita water consumption at Las Vegas for the first four months of 1942 compared with the same months for 1941. X do not believe it reasonable to assume the per capita consumption In April decreased from 383 to 185 gallons dally. Xou have shown for this month an Increase in population of almost 10,000 persona, or 116 per cent, while the increase in water consumption amounted to less, than 3 million gallons, or 2.9 per cent. X note the average dally consumption during April Increased only 96,000 gallons. Is there not some other measuring stick we can use that will more nearly reflect the actual situation with reference to per capita consumption? In order to determine the increase, can you not furnish information as to the number of water users and revenues collected, separately, for the first five months of the years 1940, 1941 and 1942, and separately for Las Vegas townsite and the various additions? This information, as X understand it, is available in your office on Form 26, "Monthly Report of Land and Water for 19 * While we all know there has been a large increase in population, is it not largely centered around Midway, Whitney, Basic Magnesium Plant and other places that are not availing themselves of water supply from our system? The average daily consumption during April and the consumption for the month of April would certainly indicate this. Will you please give this matter some further thought and advise if we cannot get a.figure here that will more nearly reflect

