Copyright & Fair-use Agreement
UNLV Special Collections provides copies of materials to facilitate private study, scholarship, or research. Material not in the public domain may be used according to fair use of copyrighted materials as defined by copyright law. Please cite us.
Please note that UNLV may not own the copyright to these materials and cannot provide permission to publish or distribute materials when UNLV is not the copyright holder. The user is solely responsible for determining the copyright status of materials and obtaining permission to use material from the copyright holder and for determining whether any permissions relating to any other rights are necessary for the intended use, and for obtaining all required permissions beyond that allowed by fair use.
Read more about our reproduction and use policy.
I agree.Information
Digital ID
Permalink
Details
More Info
Rights
Digital Provenance
Publisher
Transcription
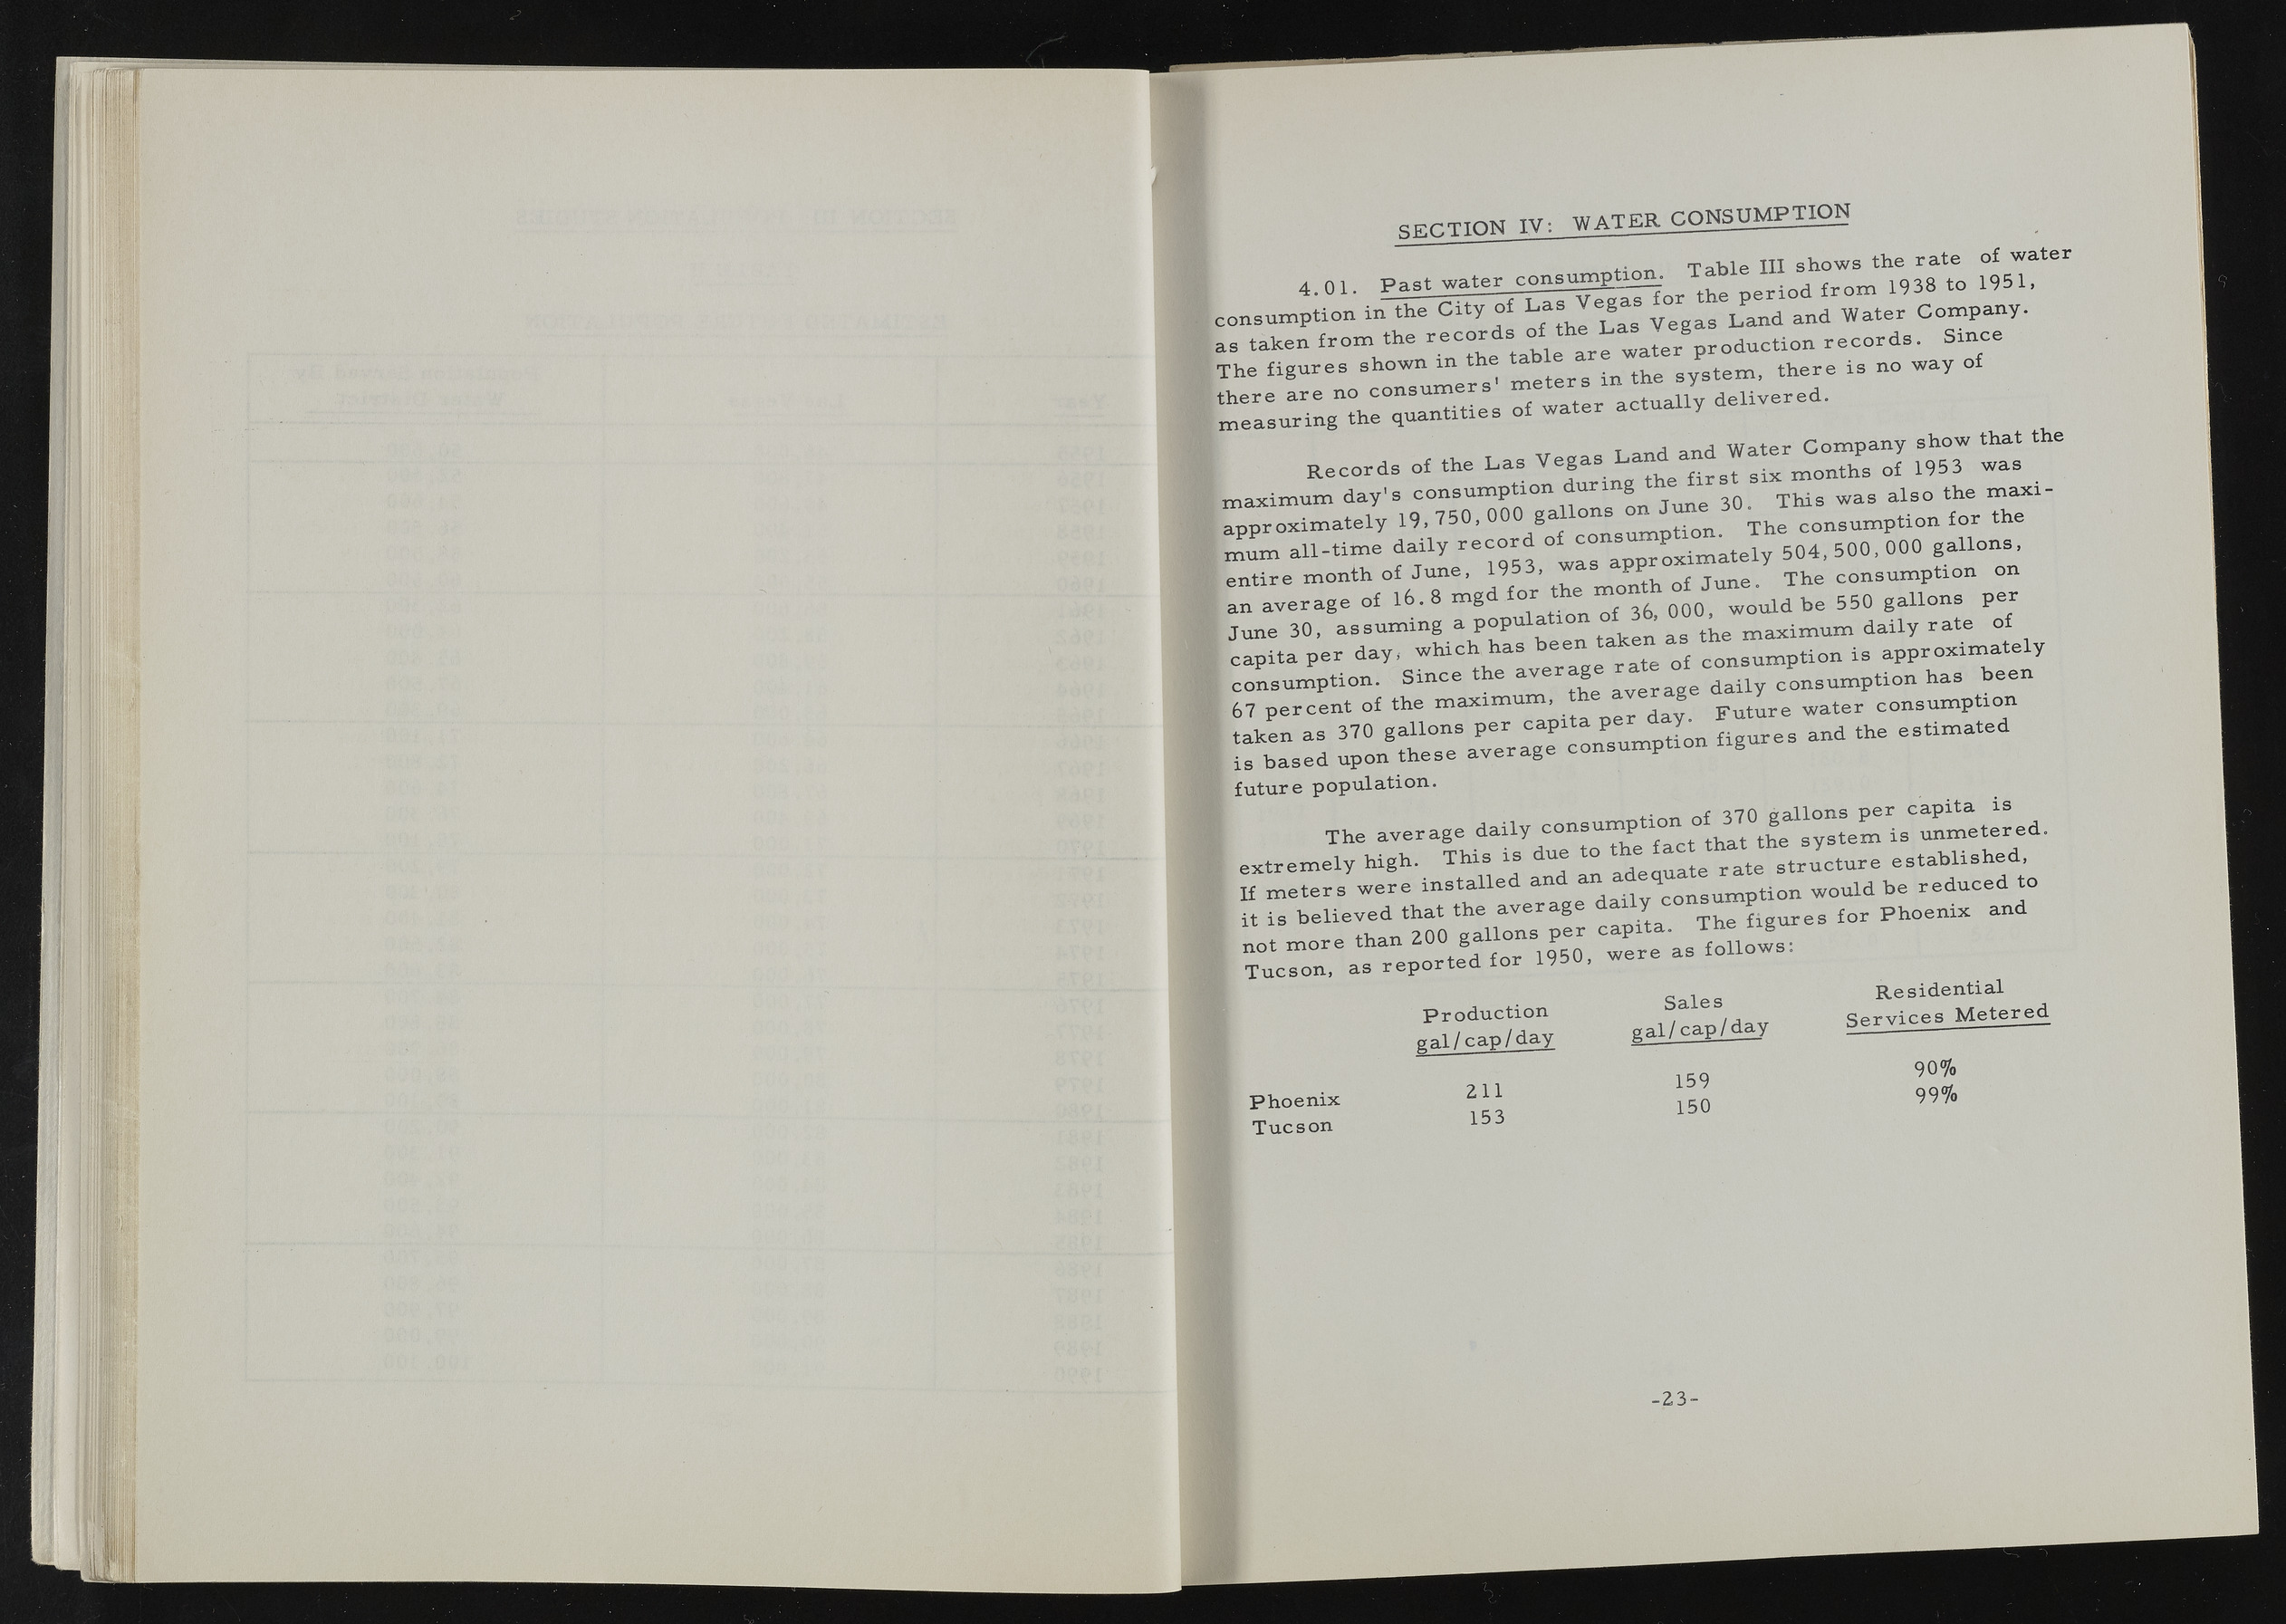
IV' WATER CONSUMPTION i 4 . 0 1 . P a st w ater c o n sumption.- 1938 to 1951, I consum ption in the C ity of l j H | W S l ‘J M and Water C om pany, as taken fr o m the wate r'p ro d u ctio n r e c o r d s . Since The fig u re s show n in t ^ in the s y s tem , there is no way of there a re no con su m ers actu ally d e liv e re d , m ea su rin g the quantities of w ater actually Records of the has Vegas - n ^ n d W ate ^Company show that t e m axim um d a y 's consum ption during t f ^ ^ a lso the m a x i-a p p rox im a tely 19, 750,000 gallon s n Jra ^ The consum ption fo r the m um a ll-tim e d aily r e c o r d o£ ^ * x im a tely 504 , 500,000 g a llon s, en tire m onth of June, 1953, P June The con su m ption on an average of 16. 8 m gd fo r t h e ^ w ould be 550 ga llon s per June 30, assu m in g a p ° pUl* * „ ken’ aa the m axim u m d aily rate of cap ita p er day, w h ich has e gW?. o f consum ption is a p p roxim a tely 8M I M i l | M W H ^ r . ^ r . T : — on fig u re s and the estim ated future population . The avera ge d aily consum ptiongiggall - ^ ^ ed. e x tre m e ly high. T his is due to esta b lish ed , If m e te rs w ere in sta lled and an -lv co n sum ption w ould be red u ce d to it is b e lie v e d that the average The fig u re s fo r P h oen ix and not m o re than ZOO gallons H g B S i S T u cson , as re p o rte d fo r 195U, we Sales Residential Production cjprvices Metered gal/cap/day ------------------ Phoenix Tucson 211 153 159 150 90% 99%

