Copyright & Fair-use Agreement
UNLV Special Collections provides copies of materials to facilitate private study, scholarship, or research. Material not in the public domain may be used according to fair use of copyrighted materials as defined by copyright law. Please cite us.
Please note that UNLV may not own the copyright to these materials and cannot provide permission to publish or distribute materials when UNLV is not the copyright holder. The user is solely responsible for determining the copyright status of materials and obtaining permission to use material from the copyright holder and for determining whether any permissions relating to any other rights are necessary for the intended use, and for obtaining all required permissions beyond that allowed by fair use.
Read more about our reproduction and use policy.
I agree.Information
Digital ID
Permalink
Details
More Info
Rights
Digital Provenance
Publisher
Transcription
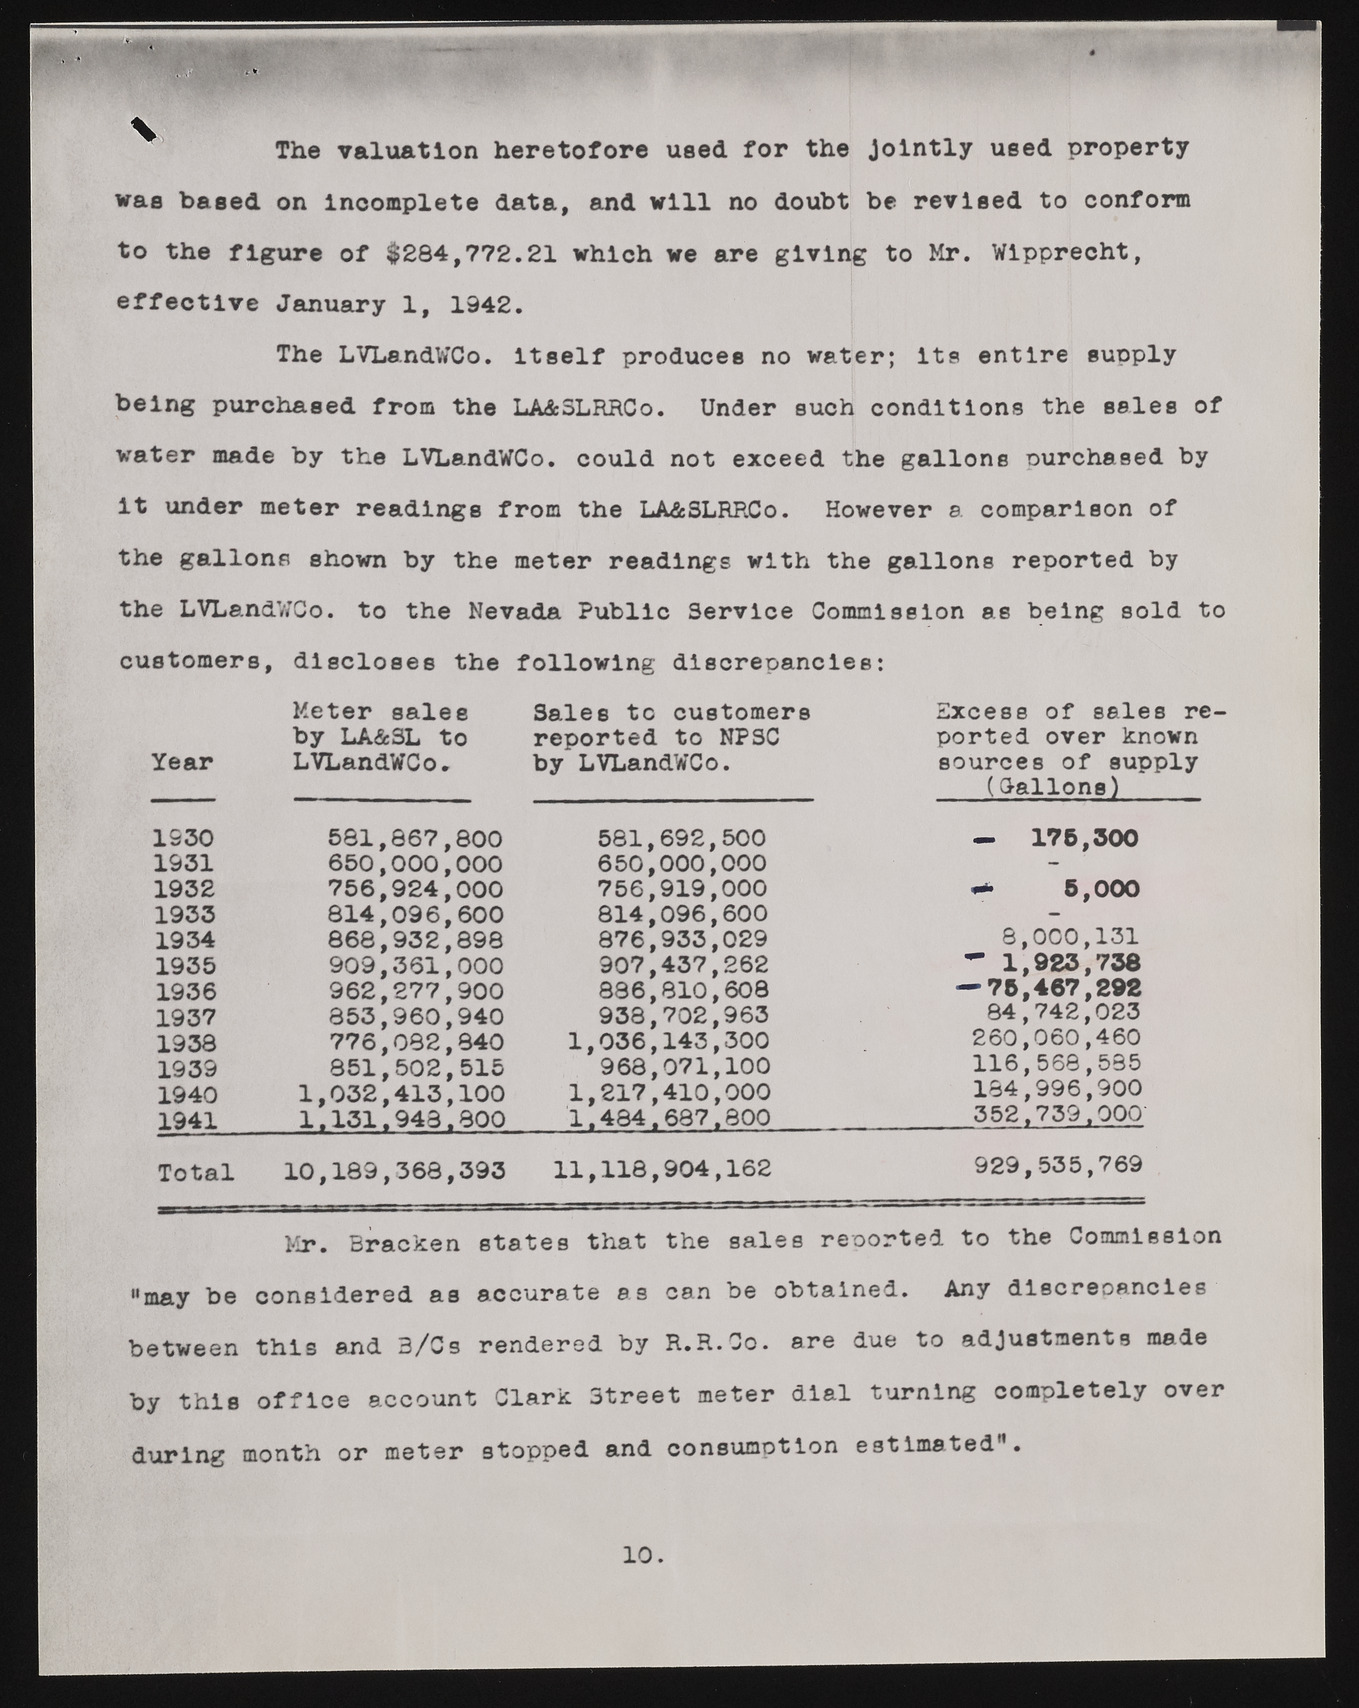
Hifr m The valuation heretofore used for the Jointly used property was based on incomplete data, and will no doubt be revised to conform to the figure of $284,772.21 which we are giving to Mr. Wipprecht, effective January 1, 1942. The LVLandWCo. Itself produces no water; its entire supply being purchased from the LA&3LRRCo. Under such conditions the sales of water made by the LVLandWCo. could not exceed the gallons purchased by it under meter readings from the LA&SLRRCo. However a comparison of the gallons shown by the meter readings with the gallons reported by the LVLandW’Co. to the Nevada Public Service Commission as being sold to customers, discloses the following discrepancies: Meter sales Sales to customers Excess of sales re by LA&SL to reported to NPSC ported over known Year LVLandWCo. by LVLandWCo. sources of supply ______ ____________ __________________ (Gallons) 1930 581,867,800 581,692,500 — 176,300 1931 650,000,000 650,000,000 9 ~ ~ 1932 756,924,000 756,919,000 6,000 1933 814,096,600 814,096,600 - 1934 868,932,898 876,933,029 8,000,131 1935 909,361,000 907,437,262 H 1,92 3 ,7 38 1936 962,277,900 886,810,608 — 76,467,292 1937 853,960,940 938,702,963 84,742,023 1938 776,082,840 1,036,143,300 260,060,460 1939 851,502,515 963,071,100 116,568,585 1940 1,032,413,100 1,217,410,000 184,996,900 1941 1.131.943.800 1.484.687.800 352.739.000 Total 10,189,368,393 11,118,904,162 929,535,769 Mr. Bracken states that the sales reoorted to the Commission "may be considered as accurate as can be obtained. Any dlscreoancles between this and 3/Cs rendered by R.R.Co. are due to adjustments made by this office account Clark Street meter dial turning completely over during month or meter stopped and consumption estimated". 10.

