Copyright & Fair-use Agreement
UNLV Special Collections provides copies of materials to facilitate private study, scholarship, or research. Material not in the public domain may be used according to fair use of copyrighted materials as defined by copyright law. Please cite us.
Please note that UNLV may not own the copyright to these materials and cannot provide permission to publish or distribute materials when UNLV is not the copyright holder. The user is solely responsible for determining the copyright status of materials and obtaining permission to use material from the copyright holder and for determining whether any permissions relating to any other rights are necessary for the intended use, and for obtaining all required permissions beyond that allowed by fair use.
Read more about our reproduction and use policy.
I agree.Information
Digital ID
Permalink
Details
Member of
More Info
Rights
Digital Provenance
Publisher
Transcription
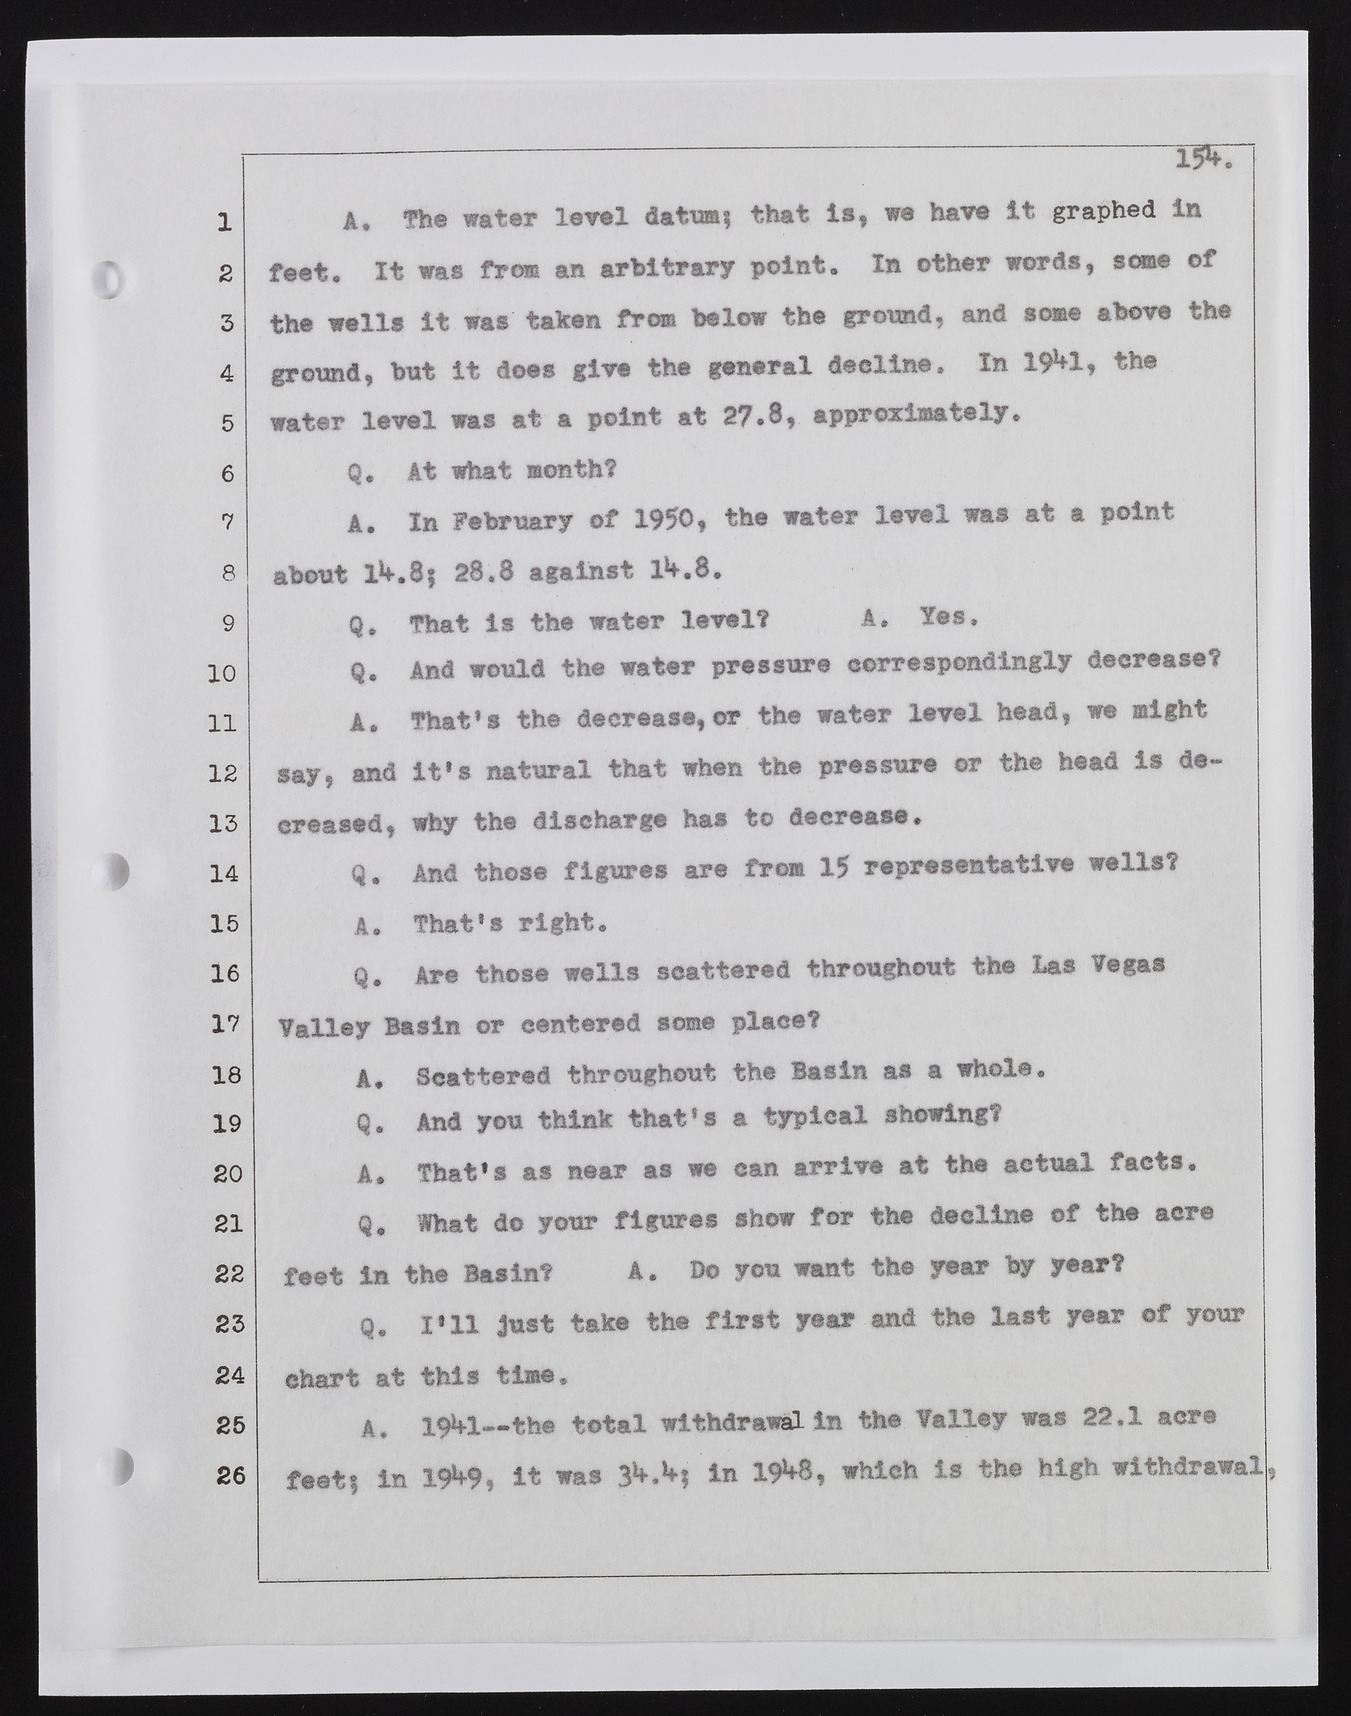
1 2 3 4 5 6 7 8 9 10 11 12 13 14 15 16 17 18 19 A* The water level data®? that is, we have it graphed in feet. It was from an arbitrary point. In other words, some of the wells it was taken from below the ground, and some above the ground, but it does give the general decline. In 19^1» the water level was at a point at 27.8, approximately. Q. At what month? A. In February of 1950, the water level was at a point about 28,8 against lM-,8. Q, That is the water level? A. Yes. Q. And would the water pressure correspondingly decrease? A. That’s the decrease, or the water level head, we might say, and it’s natural that when the pressure or the head is decreased, why the discharge has to decrease. Q, And those figures are from 15 representative wells? A. That’s right. Q. Are those wells scattered throughout the Las Vegas Valley Basin or centered some place? A. Scattered throughout the Basin as a whole. Q. And you think that’s a typical showing? A. That’s as near as we can arrive at the actual facts, Q, What do your figures show for the decline of the acre feet in the Basin? A. Do you want the year by year? q. i»ll Just take the first year and the last year of your chart at this time, A, I9*fl_the total withdrawal in the Valley was 22,1 acre feet? in 19^9, it was in 19^8, which is the high withdrawal, -------------------- ------------------------------- -- 1557"

