Copyright & Fair-use Agreement
UNLV Special Collections provides copies of materials to facilitate private study, scholarship, or research. Material not in the public domain may be used according to fair use of copyrighted materials as defined by copyright law. Please cite us.
Please note that UNLV may not own the copyright to these materials and cannot provide permission to publish or distribute materials when UNLV is not the copyright holder. The user is solely responsible for determining the copyright status of materials and obtaining permission to use material from the copyright holder and for determining whether any permissions relating to any other rights are necessary for the intended use, and for obtaining all required permissions beyond that allowed by fair use.
Read more about our reproduction and use policy.
I agree.Information
Digital ID
Permalink
Details
More Info
Rights
Digital Provenance
Publisher
Transcription
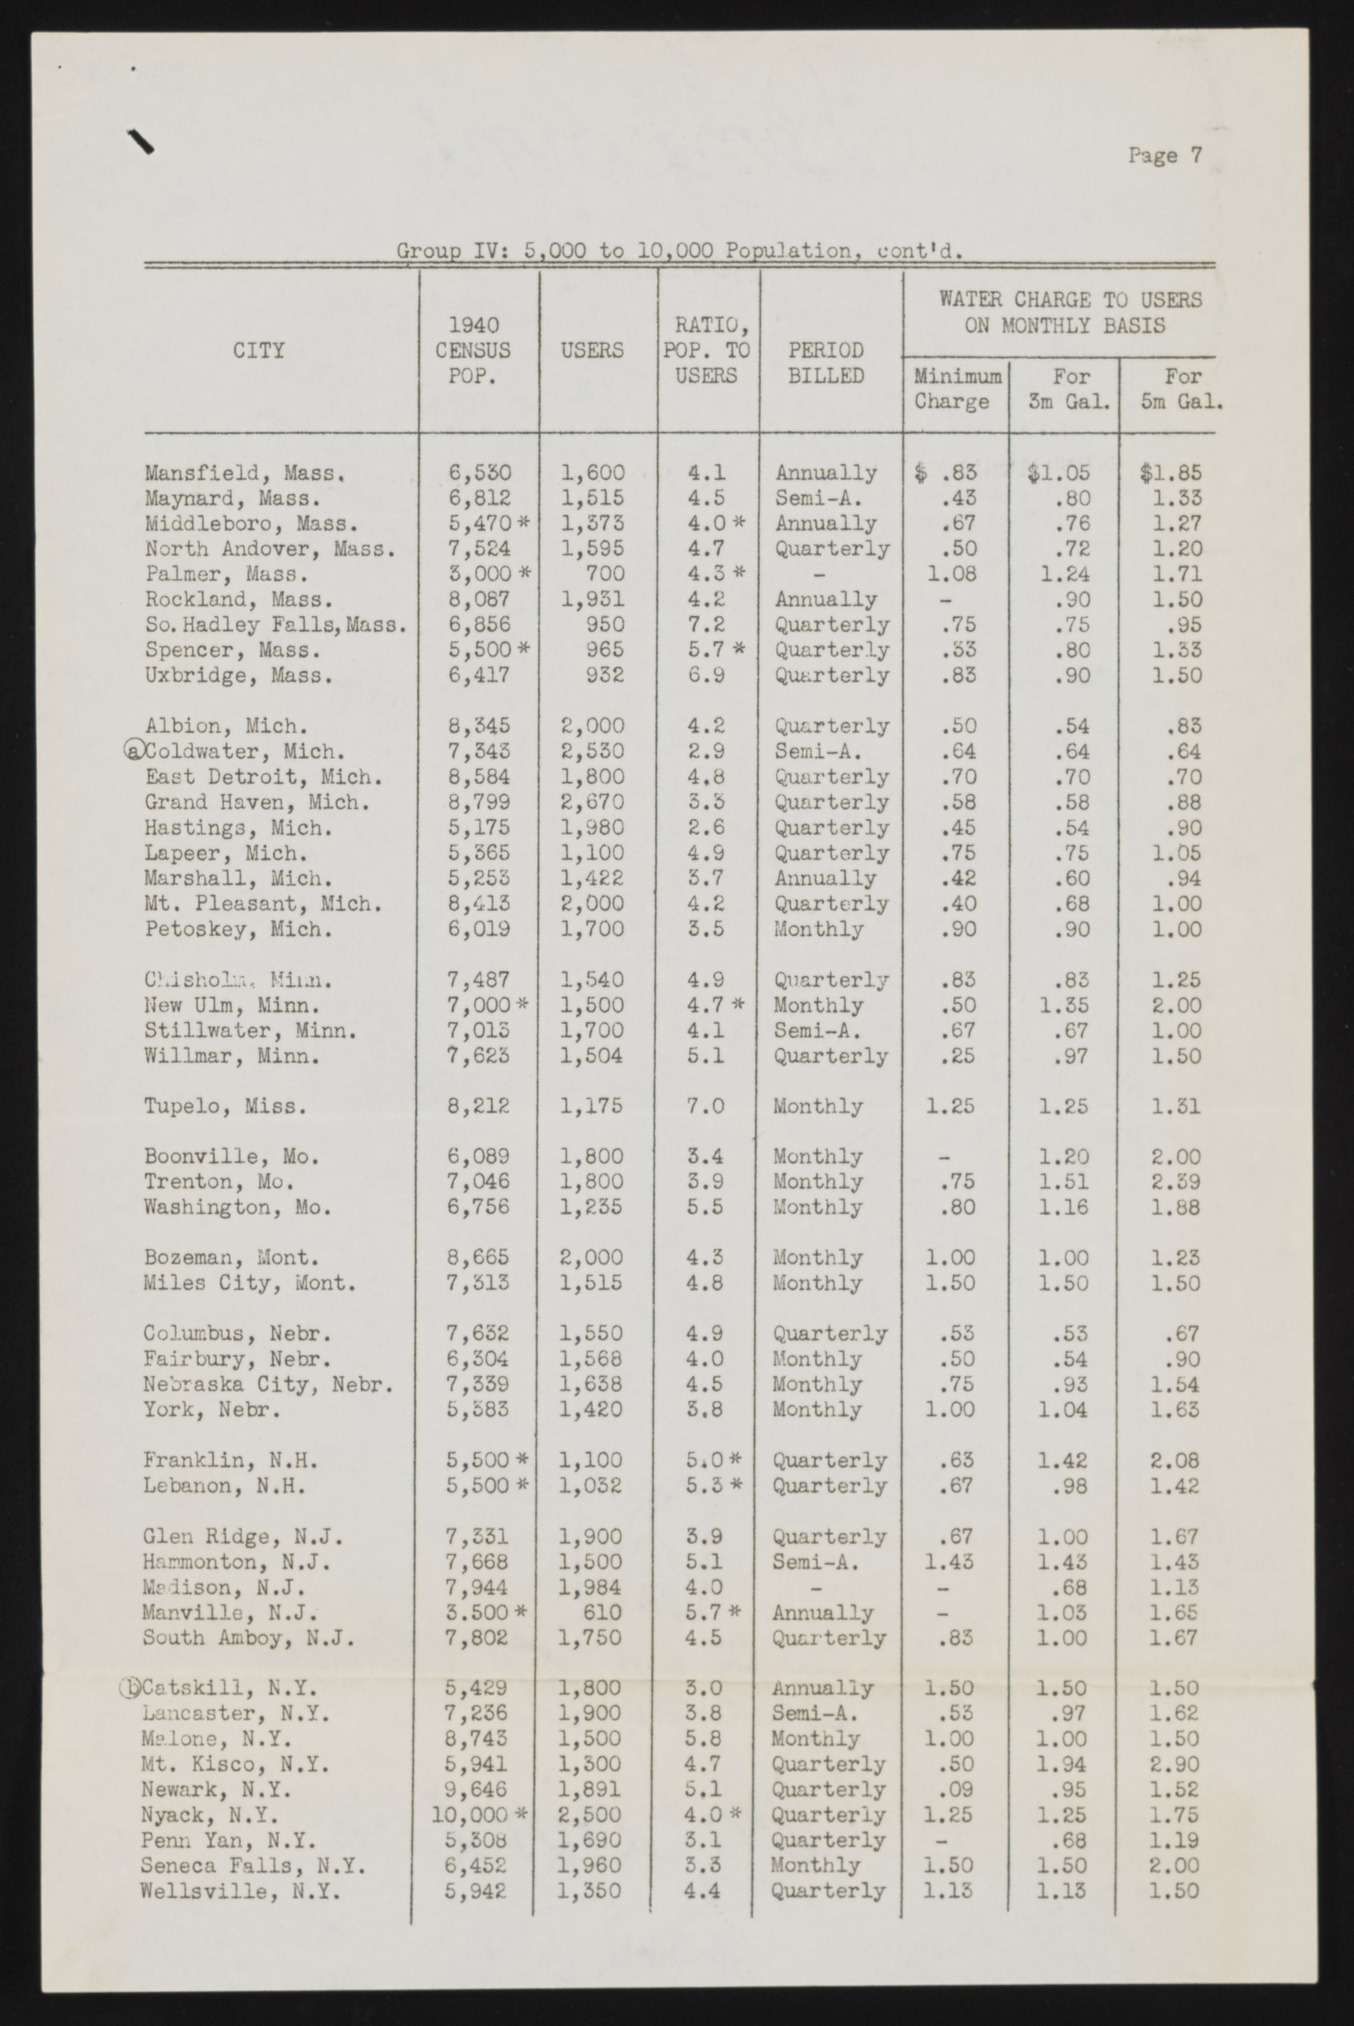
N Page 7 GroupIV: 5,000 to 10,000 Population, cont'd. CITY 1940 CENSUS POP. USERS ..... RATIO, POP. TO USERS PERIOD BILLED WATER CHARGE TO USERS ON MONTHLY BASIS Minimum Charge For 5m Gal. For 5m Gal Mansfield, Mass. 6,550 1,600 4.1 Annually | .83 41.05 $1.85 Maynard, Mass. 6,812 1,515 4.5 Semi-A. .43 .80 1.53 Middleboro, Mass. 5,470* 1,573 4.0* Annually .67 .76 1.27 North Andover, Mass. 7,524 1,595 4.7 Quarterly .50 .72 1.20 Palmer, Mass. 5,000* 700 4.3 * — 1.08 1.24 1.71 Rockland, Mass. 8,087 1,931 4.2 Annually — .90 1.50 So. Hadley Falls,Mass. 6,856 950 7.2 Quarterly .75 .75 .95 Spencer, Mass. 5,500* 965 5.7 * Quarterly .53 .80 1.53 Uxbridge, Mass. 6,417 932 6.9 Quarterly .83 .90 1.50 Albion, Mich. 8,545 2,000 4.2 Quarterly .50 .54 .83 ©Coldwater, Mich. 7,543 2,530 2.9 Semi-A. .64 .64 .64 East Detroit, Mich. 8,584 1,800 4,8 Quarterly .70 .70 .70 Grand Haven, Mich. 8,799 2,670 3.5 Quarterly .58 .58 .88 Hastings, Mich. 5,175 1,980 2.6 Quarterly .45 .54 .90 Lapeer, Mich. 5,565 1,100 4.9 Quarterly .75 .75 1.05 Marshall, Mich. 5,253 1,422 5.7 Annually .42 .60 .94 Mt. Pleasant, Mich. 8,413 2,000 4.2 Quarterly .40 .68 1.00 Petoskey, Mich. 6,019 1,700 3.5 Monthly .90 .90 1.00 CLisholu, Miui. 7,487 1,540 4.9 Quarterly .83 .83 1.25 Hew Ulm, Minn. 7,000* 1,500 4.7* Monthly .50 1.35 2.00 Stillwater, Minn. 7,015 1,700 4.1 Semi-A. .67 .67 1.00 Willmar, Minn. 7,623 1,504 5.1 Quarterly .25 .97 1.50 Tupelo, Miss. 8,212 1,175 7.0 Monthly 1.25 1.25 1.51 Boonville, Mo. 6,089 1,800 5.4 Monthly mm 1.20 2.00 Trenton, Mo. 7,046 1,800 3.9 Monthly .75 1.51 2.39 Washington, Mo. 6,756 1,235 5.5 Monthly .80 1.16 1.88 Bozeman, Mont. 8,665 2,000 4.3 Monthly 1.00 1.00 1.25 Miles City, Mont. 7,315 1,515 4.8 Monthly 1.50 1.50 1.50 Columbus, Nebr. 7,632 1,550 4.9 Quarterly .53 .53 .67 Fairbury, Nebr. 6,304 1,568 4.0 Monthly .50 .54 .90 Nebraska City, Nebr. 7,339 1,638 4.5 Monthly .75 .93 1.54 York, Nebr. 5,583 1,420 3.8 Monthly 1.00 1.04 1.65 Franklin, N.H. 5,500* 1,100 5*0* Quarterly .63 1.42 2.08 Lebanon, N.H. 5,500* 1,052 5.3* Quarterly .67 .98 1.42 Glen Ridge, N.J. 7,331 1,900 3.9 Quarterly .67 1.00 1.67 Haranonton, N.J. 7,668 1,500 5.1 Semi-A. 1.43 1.43 1.45 Madison, N.J. 7,944 1,984 4.0 — — .68 1.15 Manville, N.J. 3.500* 610 5.7* Annually — 1.05 1.65 South Amboy, N.J. 7,802 1,750 4.5 Quarterly .85 1.00 1.67 QCatskill, N.Y. 5,429 1,800 3.0 Annually 1.50 1.50 1.50 Lancaster, N.Y. 7,236 1,900 5.8 Semi-A. .53 .97 1.62 Malone, N.Y. 8,743 1,500 5.8 Monthly 1.00 1.00 1.50 Mt. Kisco, N.Y. 5,941 1,300 4.7 Quarterly .50 1.94 2.90 Newark, N.Y. 9,646 1,891 5,1 Quarterly .09 .95 1.52 Nyack, N.Y. 10,000* 2,500 4.0* Quarterly 1.25 1.25 1.75 Penn Yan, N.Y. 5,508 1,690 3.1 Quarterly — .68 1.19 Seneca Falls, N.Y. 6,452 1,960 5.3 Monthly 1.50 1.50 2.00 Wellsville, N.Y. 5,942 1,350 4.4 Quarterly 1.15 1.15 1.50

