Copyright & Fair-use Agreement
UNLV Special Collections provides copies of materials to facilitate private study, scholarship, or research. Material not in the public domain may be used according to fair use of copyrighted materials as defined by copyright law. Please cite us.
Please note that UNLV may not own the copyright to these materials and cannot provide permission to publish or distribute materials when UNLV is not the copyright holder. The user is solely responsible for determining the copyright status of materials and obtaining permission to use material from the copyright holder and for determining whether any permissions relating to any other rights are necessary for the intended use, and for obtaining all required permissions beyond that allowed by fair use.
Read more about our reproduction and use policy.
I agree.Information
Digital ID
Permalink
Details
More Info
Rights
Digital Provenance
Publisher
Transcription
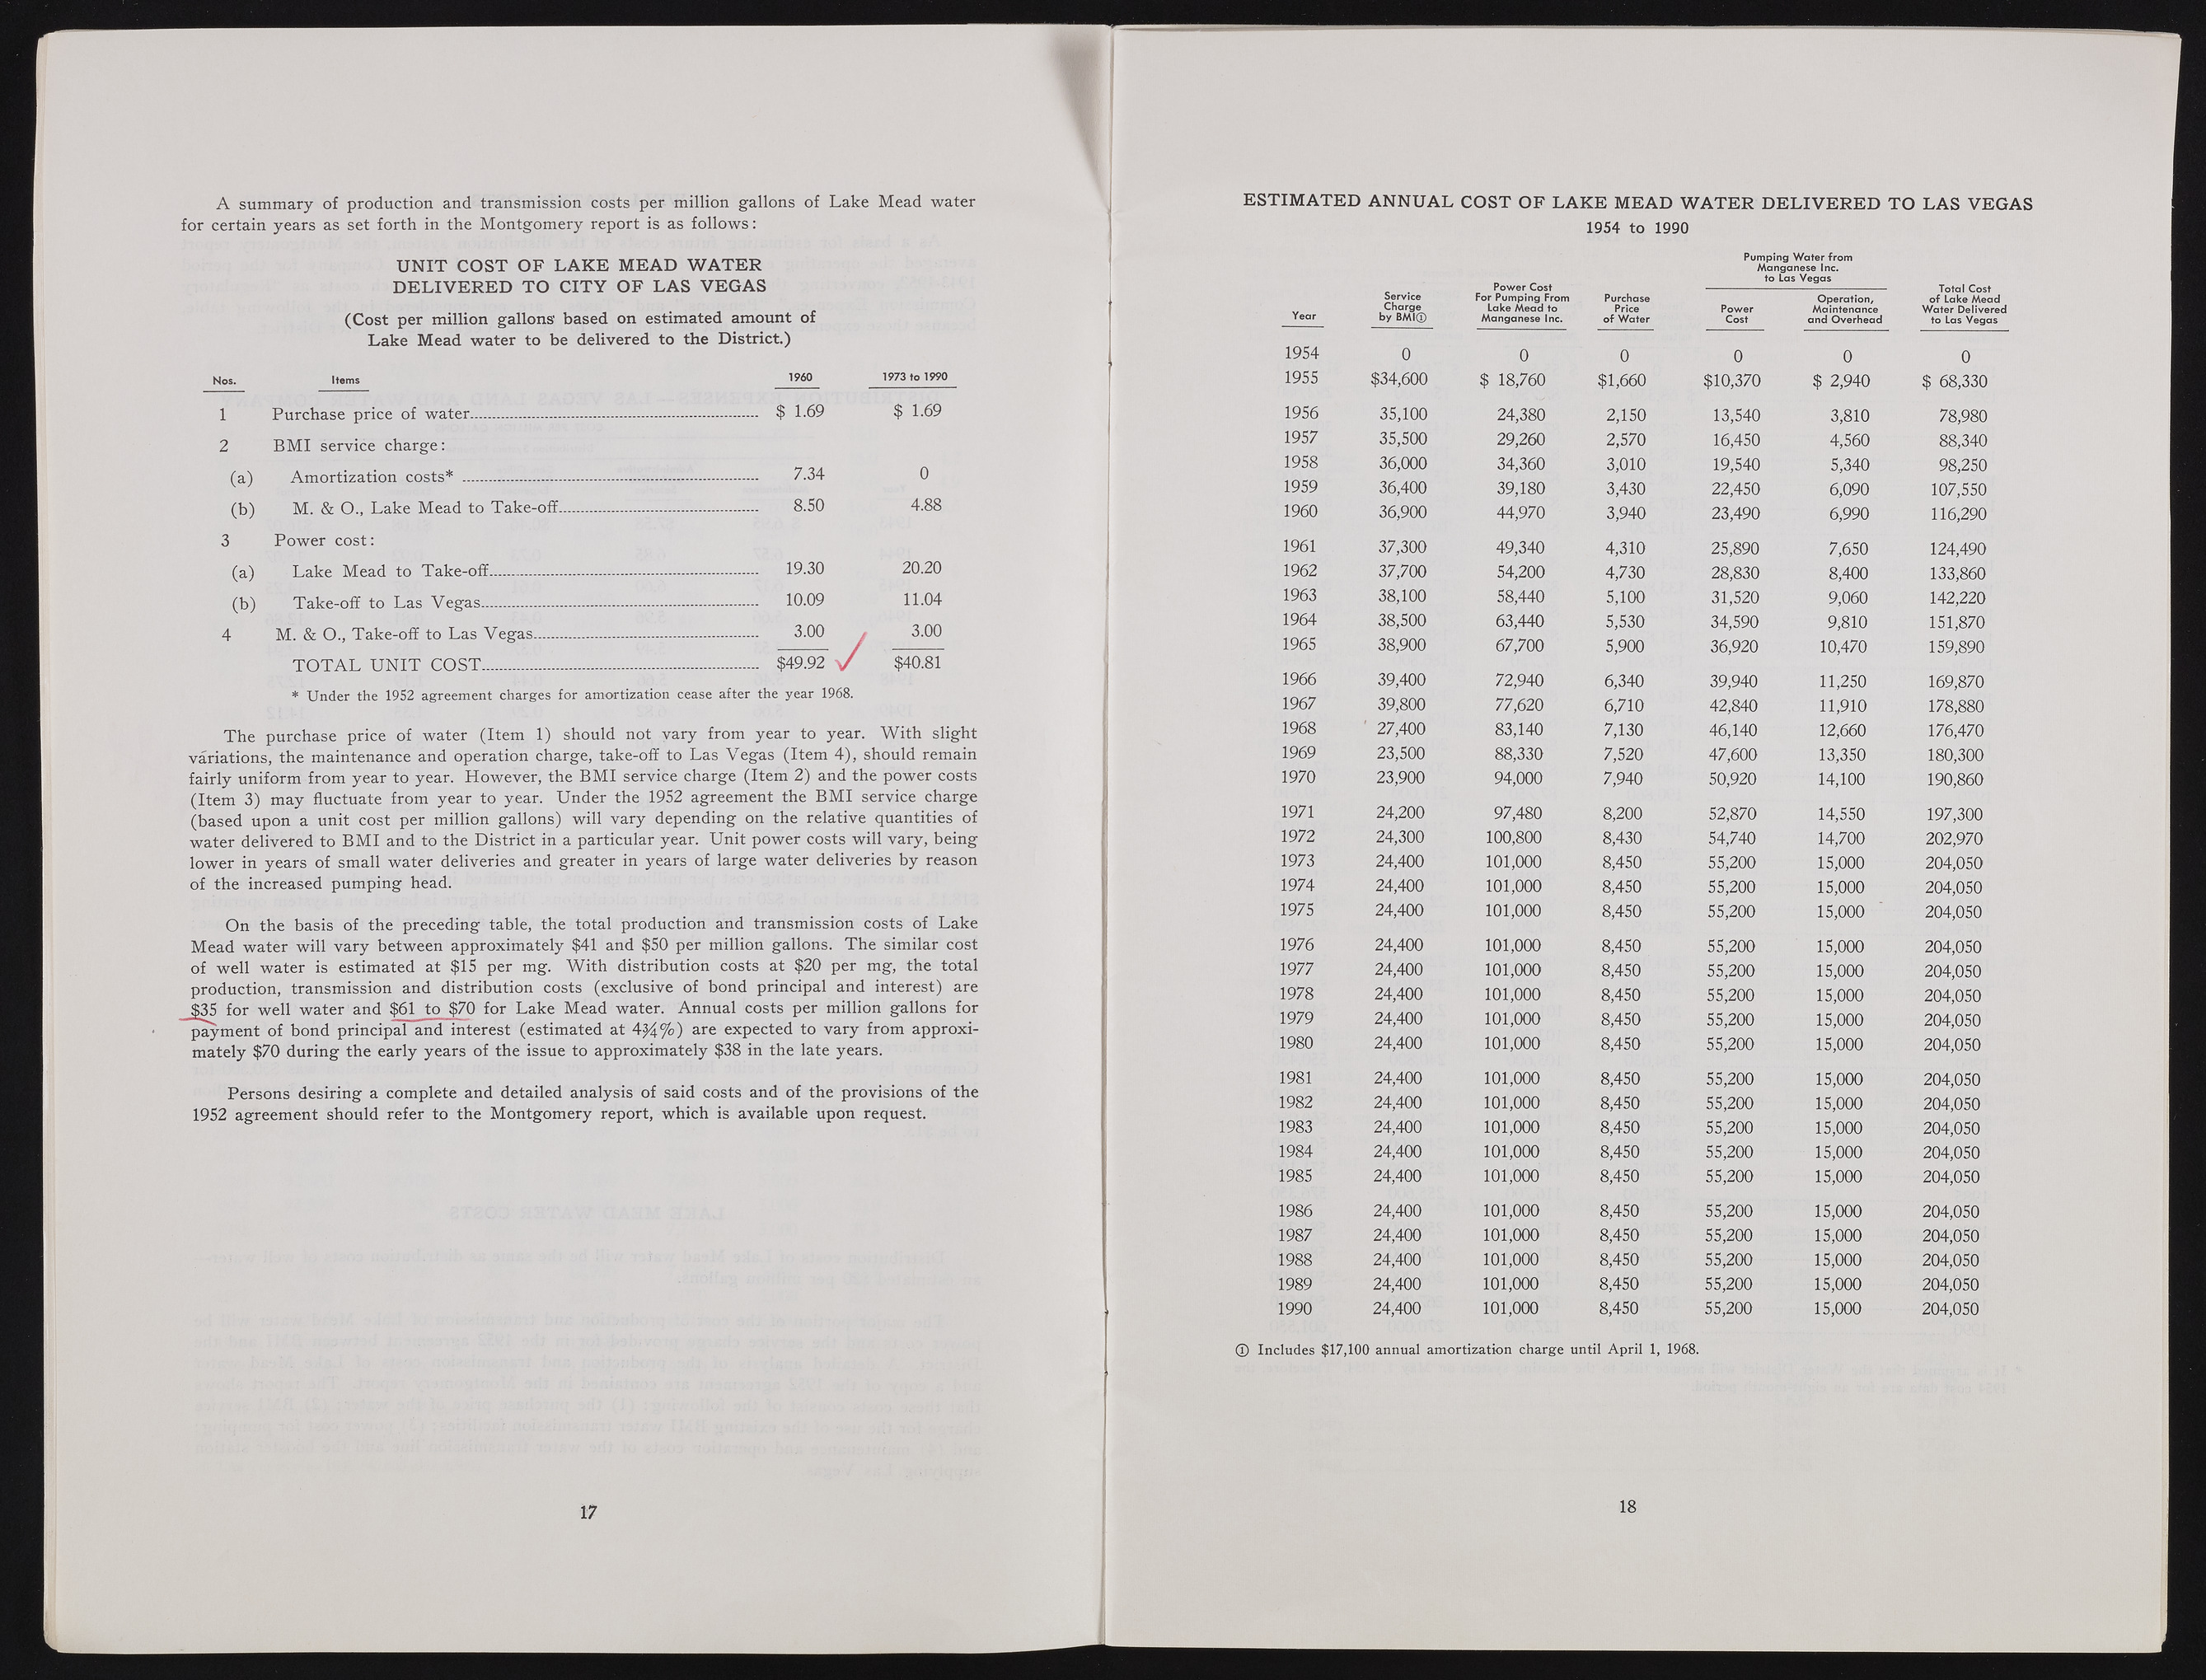
A summary of production and transmission costs per million gallons of Lake Mead water for certain years as set forth in the Montgomery report is as follows: U N IT COST O F L A K E MEAD W A T E R D E L IV E R E D TO C IT Y O F LA S VEGAS (Cost per million gallons based on estimated amount of Lake Mead water to be delivered to the District.) Nos. Items 1960 1973 to 1990 l Purchase price of water................................................ ...................... $ 1.69 $ 1.69 2 BMI service charge: (a) Amortization costs* .................................................. ...................... 7.34 0 (b) M. & O., Lake Mead to Take-off.......................... ...................... 8.50 4.88 3 Power cost: (a) Lake Mead to Take-off........................................... ...................... 19.30 20.20 (b) Take-off to Las Vegas............................................- ...................... 10.09 11.04 4 M. & O., Take-off to Las Vegas.........................——....................... 3.00 3.00 f T O T A L U N IT COST............................................. ...................... $49.92 y / $40.81 * Under the 19S2 agreement charges for amortization cease after the year 1968. The purchase price of water (Item 1) should not vary from year to year. With slight variations, the maintenance and operation charge, take-off to Las Vegas (Item 4), should remain fairly uniform from year to year. However, the BMI service charge (Item 2) and the power costs (Item 3) may fluctuate from year to year. Under the 1952 agreement the BMI service charge (based upon a unit cost per million gallons) will vary depending on the relative quantities of water delivered to BMI and to the District in a particular year. Unit power costs will vary, being lower in years of small water deliveries and greater in years of large water deliveries by reason of the increased pumping head. On the basis of the preceding table, the total production and transmission costs of Lake Mead water will vary between approximately $41 and $50 per million gallons. The similar cost of well water is estimated at $15 per mg. With distribution costs at $20 per mg, the total production, transmission and distribution costs (exclusive of bond principal and interest) are $35 for well water and $61 to $70 for Lake Mead water. Annual costs per million gallons for payment of bond principal and interest (estimated at 4)4% ) are expected to vary from approximately $70 during the early years of the issue to approximately $38 in the late years. Persons desiring a complete and detailed analysis of said costs and of the provisions of the 1952 agreement should refer to the Montgomery report, which is available upon request. If ESTIMATED ANNUAL COST OF LAKE MEAD W ATER DELIVERED TO LAS VEGAS 1954 to 1990 Pumping Water from Manganese Inc. Year Service Charge by BM I® Power Cost For Pumping From Lake Mead to Manganese Inc. Purchase Price of Water Power Cost to Las Vegas Operation/ Maintenance and Overhead Total Cost of Lake Mead Water Delivered to Las Vegas 1954 0 0 0 0 0 0 1955 $34,600 $ 18,760 $1,660 $10,370 $ 2,940 $ 68,330 1956 35,100 24,380 2,150 13,540 3,810 78,980 1957 35,500 29,260 2,570 16,450 4,560 88,340 1958 36,000 34,360 3,010 19,540 5,340 98,250 1959 36,400 39,180 3,430 22,450 6,090 107,550 1960 36,900 44,970 3,940 23,490 6,990 116,290 1961 37,300 49,340 4,310 25,890 7,650 124,490 1962 37,700 54,200 4,730 28,830 8,400 133,860 1963 38,100 58,440 5,100 31,520 9,060 142,220 1964 38,500 63,440 5,530 34,590 9,810 151,870 1965 38,900 67,700 5,900 36,920 10,470 159,890 1966 39,400 72,940 6,340 39,940 11,250 169,870 1967 39,800 77,620 6,710 42,840 11,910 178,880 1968 ' 27,400 83,140 7,130 46,140 12,660 176,470 1969 23,500 88,330 7,520 47,600 13,350 180,300 1970 23,900 94,000 7,940 50,920 14,100 190,860 1971 24,200 97,480 8,200 52,870 14,550 197,300 1972 24,300 100,800 8,430 54,740 14,700 202,970 1973 24,400 101,000 8,450 55,200 15,000 204,050 1974 24,400 101,000 8,450 55,200 15,000 204,050 1975 24,400 101,000 8,450 55,200 15,000 204,050 1976 24,400 101,000 8,450 55,200 15,000 204,050 1977 24,400 101,000 8,450 55,200 15,000 204,050 1978 24,400 101,000 8,450 55,200 15,000 204,050 1979 24,400 101,000 8,450 55,200 15,000 204,050 1980 24,400 101,000 8,450 55,200 15,000 204,050 1981 24,400 101,000 8,450 55,200 15,000 204,050 1982 24,400 101,000 8,450 55,200 15,000 204,050 1983 24,400 101,000 8,450 55,200 15,000 204,050 1984 24,400 101,000 8,450 55,200 15,000 204,050 1985 24,400 101,000 8,450 55,200 15,000 204,050 1986 24,400 101,000 8,450 55,200 15,000 204,050 1987 24,400 101,000 8,450 55,200 15,000 204,050 1988 24,400 101,000 8,450 55,200 15,000 204,050 1989 24,400 101,000 8,450 55,200 15,000 204,050 1990 24,400 101,000 8,450 55,200 15,000 204,050 ® Includes $17,100 annual amortization charge until April 1, 1968. 18

