Copyright & Fair-use Agreement
UNLV Special Collections provides copies of materials to facilitate private study, scholarship, or research. Material not in the public domain may be used according to fair use of copyrighted materials as defined by copyright law. Please cite us.
Please note that UNLV may not own the copyright to these materials and cannot provide permission to publish or distribute materials when UNLV is not the copyright holder. The user is solely responsible for determining the copyright status of materials and obtaining permission to use material from the copyright holder and for determining whether any permissions relating to any other rights are necessary for the intended use, and for obtaining all required permissions beyond that allowed by fair use.
Read more about our reproduction and use policy.
I agree.Information
Digital ID
Permalink
Details
Member of
More Info
Rights
Digital Provenance
Publisher
Transcription
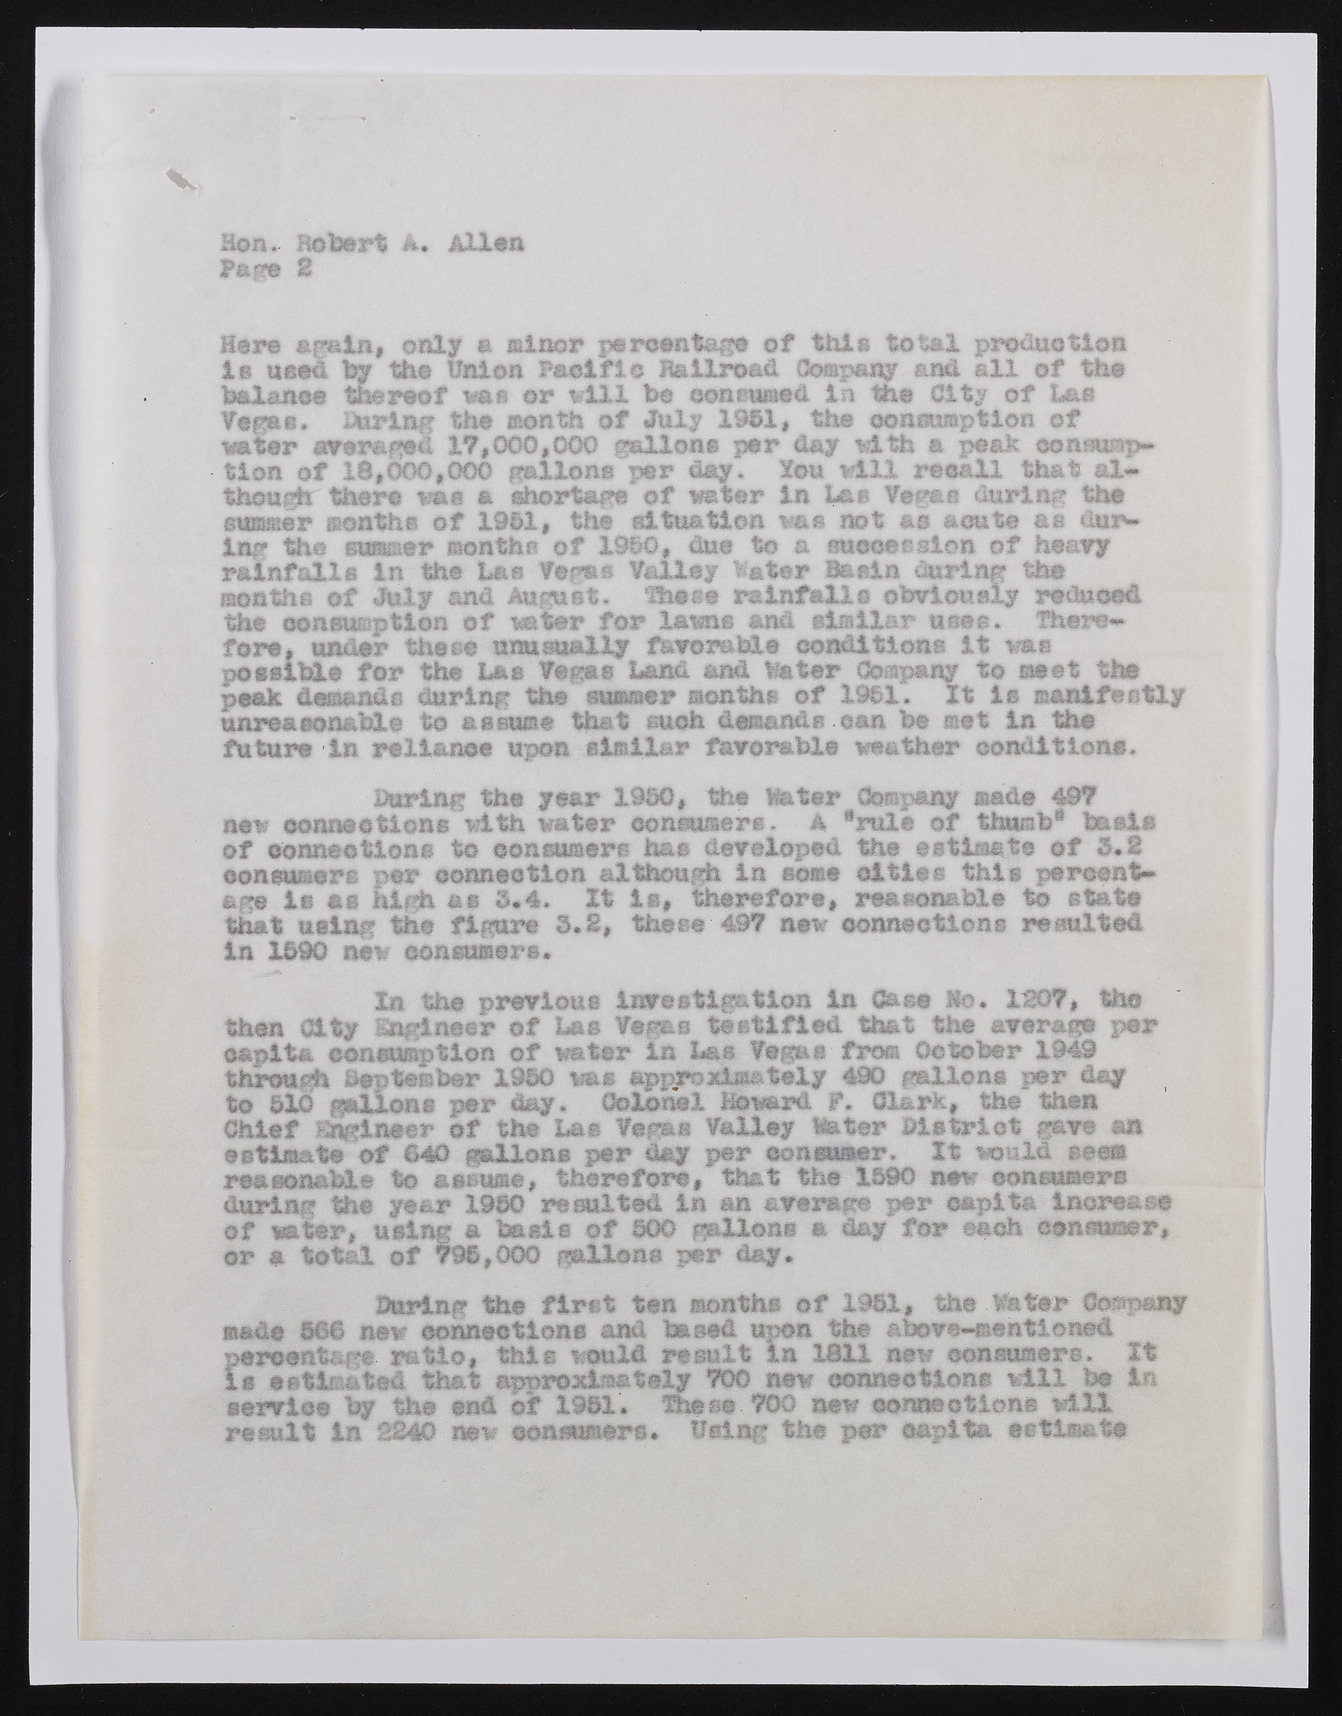
Hon.. Robert 2 Allen &e Here again, only a minor percentage of this total production is used by the Union Pacific Railroad Company and all of the balance thereof van or vill fee consumed in the City of las Vegas* During the month of July 1951, the consumption of vater averaged 17,000,000 gallons per day with a peak eeasump- tion of 18,000,000 gallons per day. Xou vill recall that although there vas a shortage of water in Las Vegas during the summer months of 1951, the situation was not as acute as dulling the summer months of 1950, due to a succession of heavy rainfalls in the Las Vegas Valley Voter Basin during the month a of July and August. ‘Then® rainfalls obviously reduced the consumption of voter for lawns and similar uses. Therefore, under these unusually favorable conditions it was possible for the Las Vegas Land and Water Company to meet the peak demands during the summer months of 1951. It is manifestly unreasonable to assume that such demands.can fee met in the future In reliance upon similar favorable weather conditions. During the year 1950, the Hater Company made 497 new connections with water consumers. A “rule of thumb* basis of connections to consumers has developed the estimate of 3*2 consumers per connection although In some cities this percentage is as high as 3*4. It is, therefore, reasonable to state that using the figure 3*2, these 497 new connections resulted in 1590 new consumers* In the previous investigation In Case Mo. 1207, the then City Engineer of Las Vegas testified that the average per capita consumption of water in Las Vegas fro® October 1949 through September 1950 was approximately 490 gallons per day ' , to 510 gallons per day. Colonel Howard f. Clark, the then Chief Engineer of the Las Vegas Valley Hater District gave an estimate of 640 gallons per day per consumer. It would seem reasonable to assume, therefore, that the 1590 new con earners during the year 1950 resulted in an average per capita increase of water, using a basis of 500 gallons a day for each consumer, or a total of 795,000 gallons per day. During the first ten months of 1951, the Water Company made 566 new connections and based upon the above-mentioned percentage ratio, this would result In 1811 new consumers. It is estimated that approximately 700 new connections will fee in service fey the end of 1981. These 700 new connections will result in 2240 new consumers. SIsing the per capita estimate

