Copyright & Fair-use Agreement
UNLV Special Collections provides copies of materials to facilitate private study, scholarship, or research. Material not in the public domain may be used according to fair use of copyrighted materials as defined by copyright law. Please cite us.
Please note that UNLV may not own the copyright to these materials and cannot provide permission to publish or distribute materials when UNLV is not the copyright holder. The user is solely responsible for determining the copyright status of materials and obtaining permission to use material from the copyright holder and for determining whether any permissions relating to any other rights are necessary for the intended use, and for obtaining all required permissions beyond that allowed by fair use.
Read more about our reproduction and use policy.
I agree.Information
Digital ID
Permalink
More Info
Rights
Digital Provenance
Publisher
Transcription
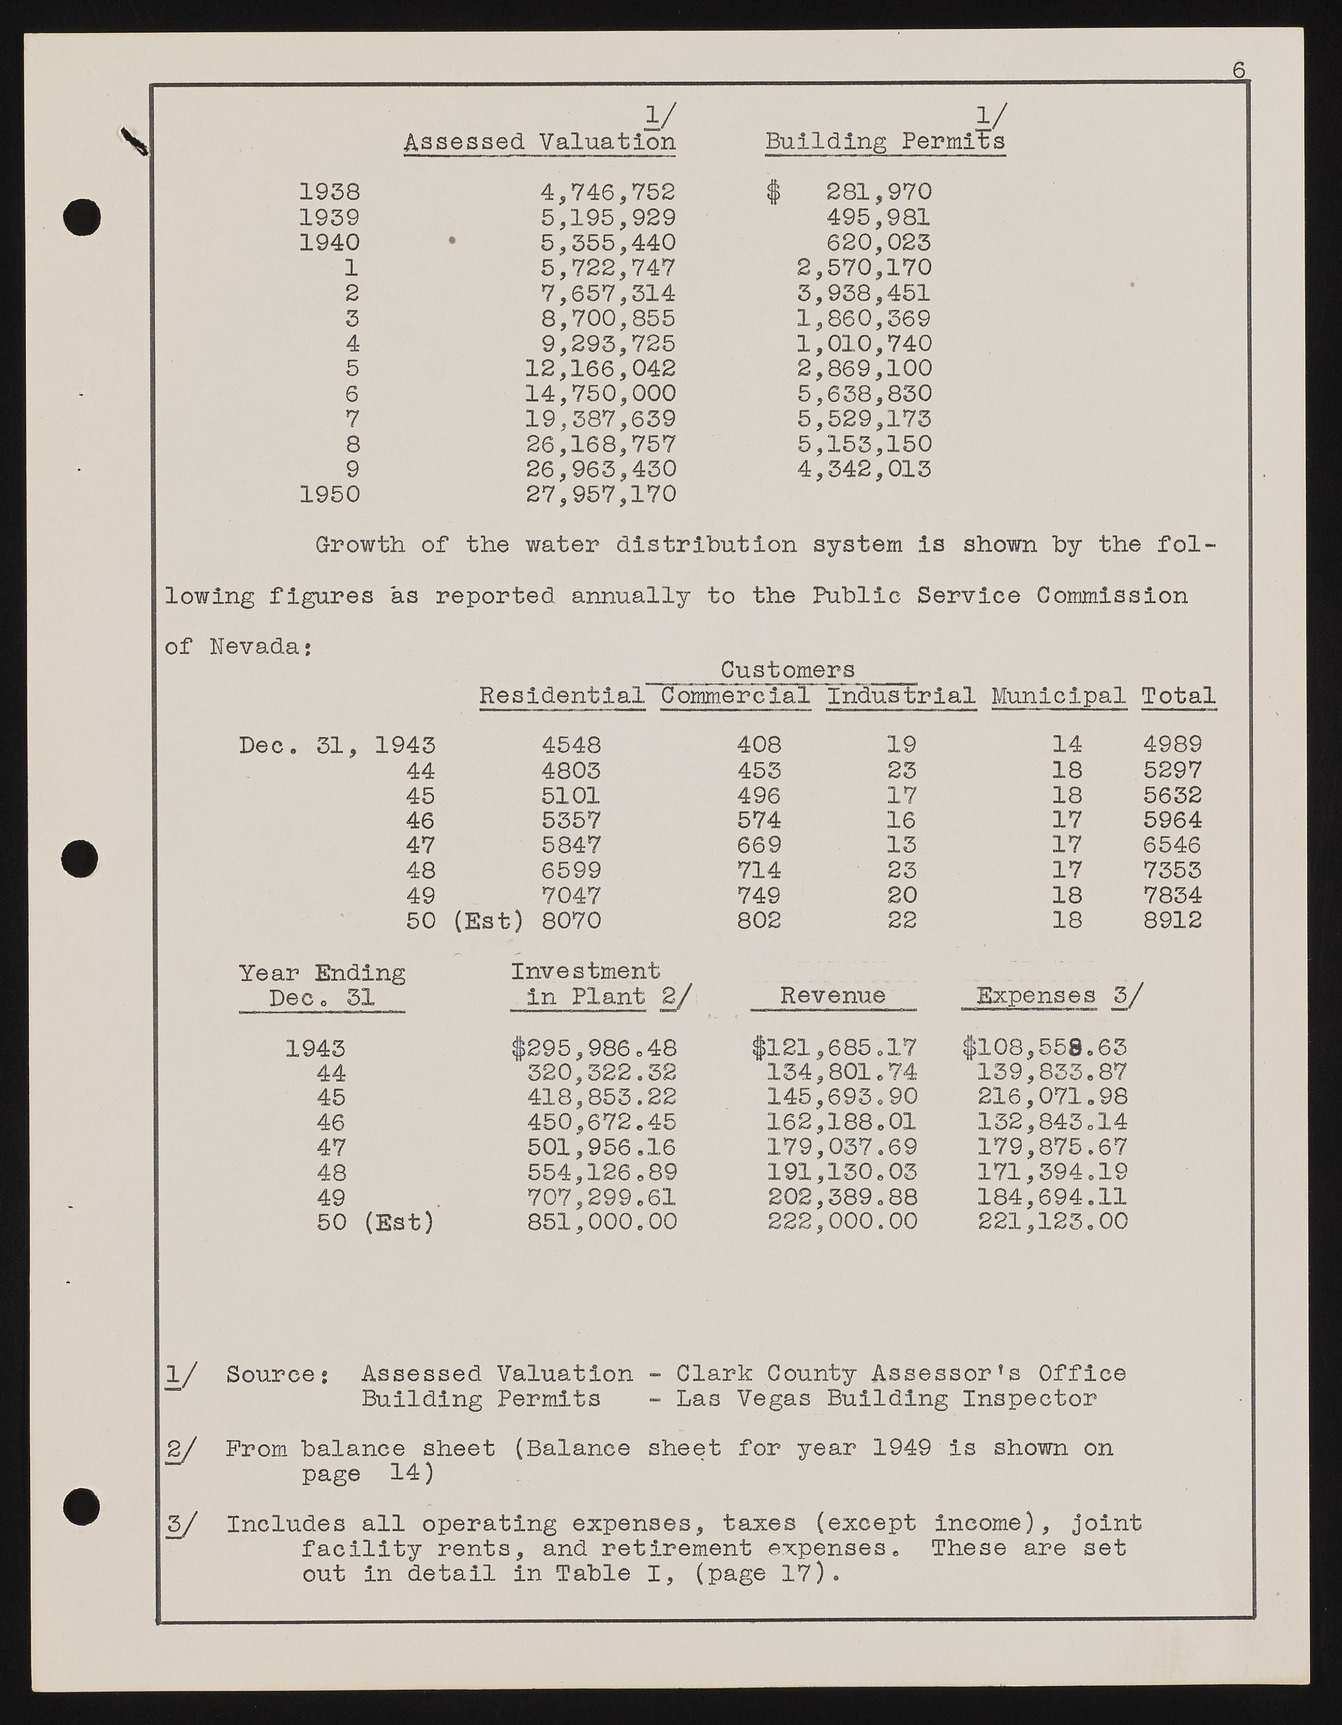
6 y y Assessed Valuati.oonn Building Permits 1938 4,746,752 # 281,970 1939 5,195,929 495,981 1940 • 5,355,440 620,025 1 5,722,747 2,570,170 2 7,657,314 3,938,451 3 8,700,855 1,860,369 4 9,293,725 1,010,740 5 12,166,042 2,869,100 6 14,750,000 5,638,850 7 19,387,639 5,529,175 8 26,168,757 5,153,150 9 26,963,430 4,342,013 1950 27,957,170 Growth of the water distribution system is shown by the following figures as reported annually to the Public Service Commission of Nevada: _____Customers____ Residential Commercial Industrial Municipal Total 1943 4548 408 19 14 4989 44 4803 453 23 18 5297 45 5101 496 17 18 5632 46 5357 574 16 17 5964 47 5847 669 13 17 6546 48 6599 714 23 17 7353 49 7047 749 2 0 18 7834 50 (Est) 8070 802 22 18 8912 Year Ending Dec. 51 Investment in Plant 2/ Revenue Expenses 3/ 1943 44 45 46 47 48 49 50 (Est) #295,986.48 320,322.52 418,853.22 450,672.45 501,956.16 554,126.89 707,299.61 851,000.00 #121,685.17 134,801.74 145,695.90 162,188.01 179,037.69 191,130.03 202,389.88 2 2 2 ,0 0 0 . 0 0 #108,558.63 139,833.87 216,071.98 132,843.14 179,875.67 171,394.19 184,694.11 221,123.00 1/ Source: Assessed Valuation - Clark County Assessor’s Office Building Permits - Las Vegas Building Inspector 2/ Prom balance sheet (Balance sheet for year 1949 is shown on page 14) 3/ Includes all operating expenses, taxes (except income), joint facility rents, and retirement expenses. These are set out in detail in Table I, (page 17).

