Copyright & Fair-use Agreement
UNLV Special Collections provides copies of materials to facilitate private study, scholarship, or research. Material not in the public domain may be used according to fair use of copyrighted materials as defined by copyright law. Please cite us.
Please note that UNLV may not own the copyright to these materials and cannot provide permission to publish or distribute materials when UNLV is not the copyright holder. The user is solely responsible for determining the copyright status of materials and obtaining permission to use material from the copyright holder and for determining whether any permissions relating to any other rights are necessary for the intended use, and for obtaining all required permissions beyond that allowed by fair use.
Read more about our reproduction and use policy.
I agree.Information
Digital ID
Permalink
Details
More Info
Rights
Digital Provenance
Publisher
Transcription
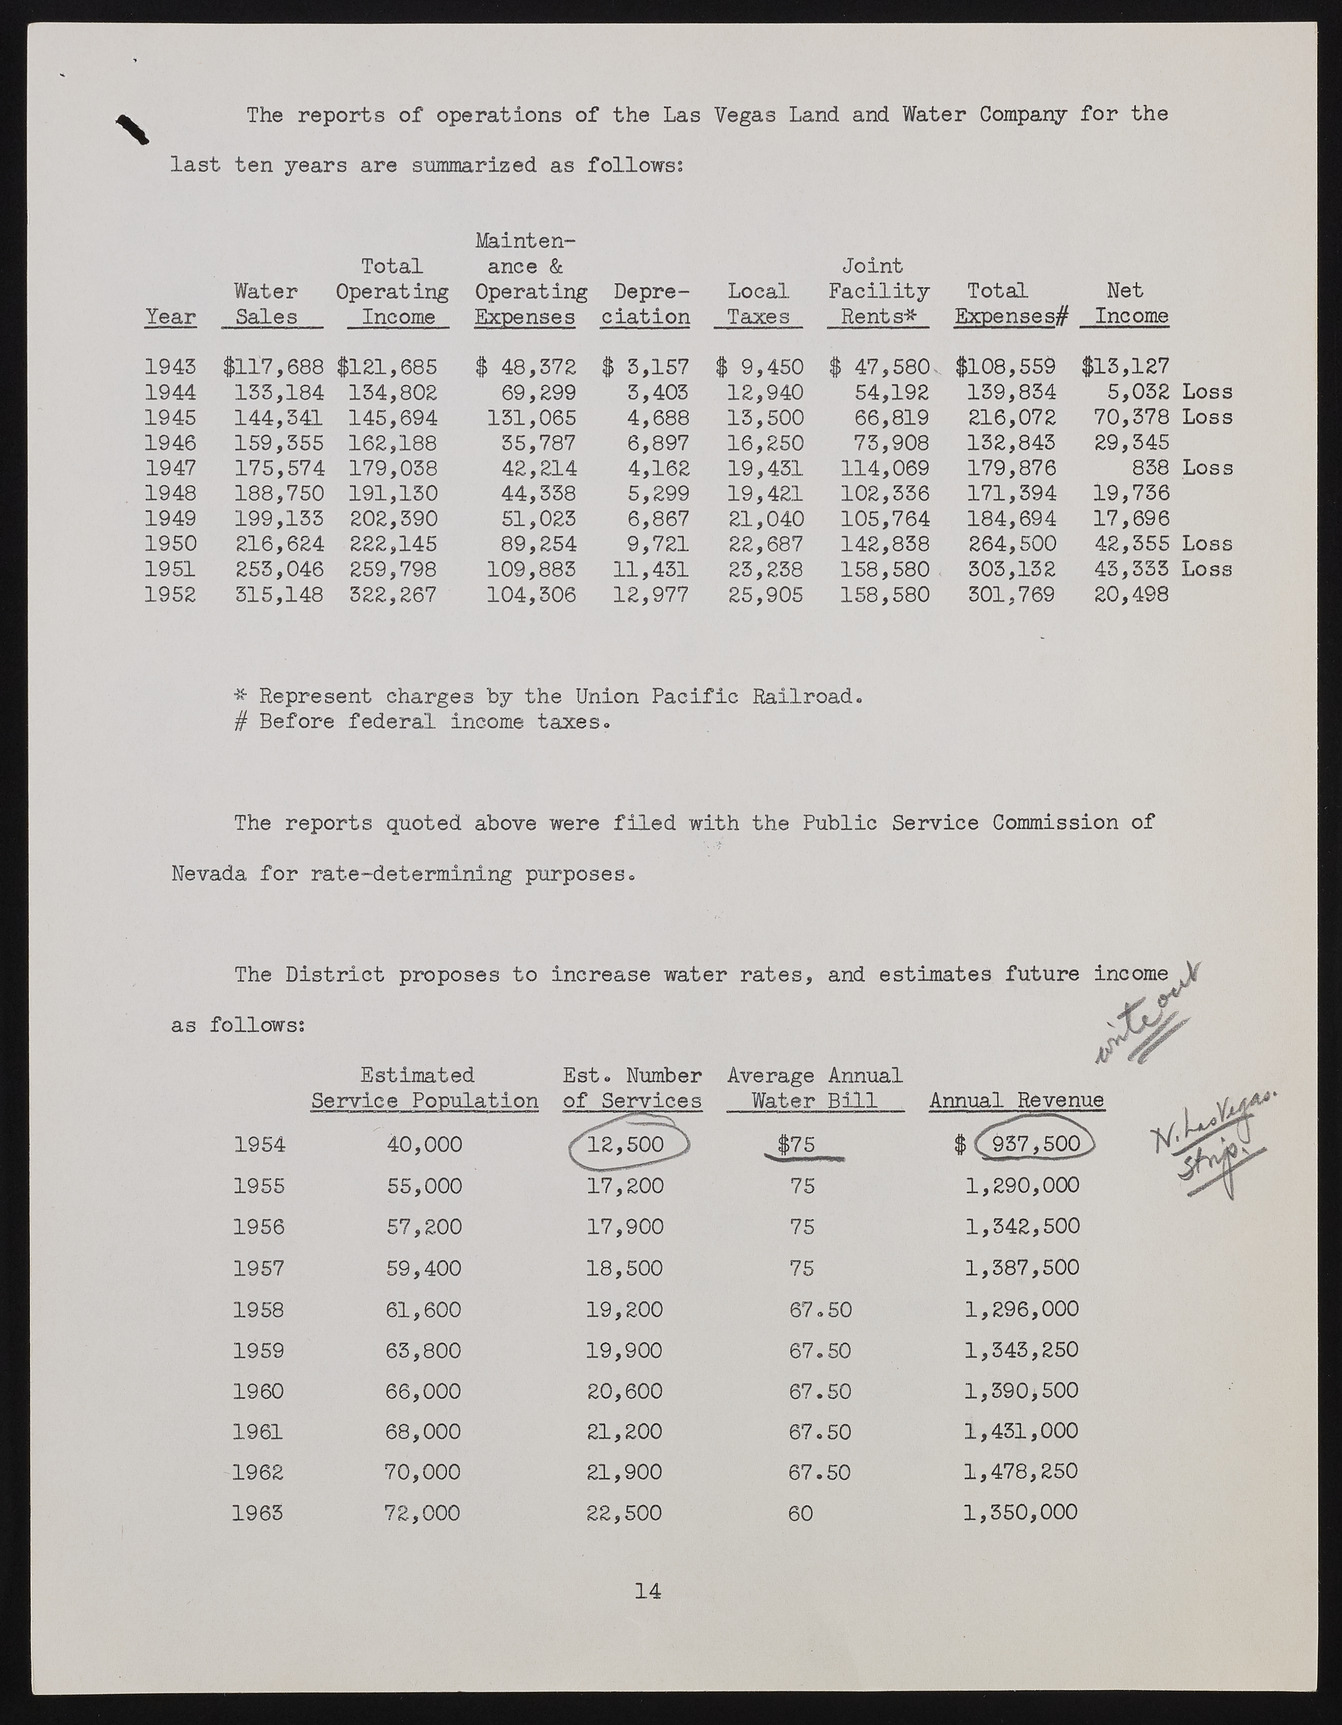
The reports of operations of the Las Vegas Land and Water Company for the \ last ten years are summarized as follows; Mainten- Year Water Sales Total Operating Income ance & Operating Expenses Depreciation Local Taxes Joint Facility Rents* Total Expenses# Net Income 1945 $117,688 $121,685 $ 48,372 $ 3,157 $ 9,450 $ 47,580v $108,559 $13,127 1944 153,184 134,802 69,299 3,403 12,940 54,192 139,834 5,032 Loss 1945 144,541 145,694 131,065 4,688 13,500 66,819 216,072 70,378 Loss 1946 159,355 162,188 35,787 6,897 16,250 73,908 132,843 29,345 1947 175,574 179,038 42,214 4,162 19,431 114,069 179,876 838 Loss 1948 188,750 191,130 44,338 5,299 19,421 102,336 171,394 19,736 1949 199,133 202,390 51,023 6,867 21,040 105,764 184,694 17,696 1950 216,624 222,145 89,254 9,721 22,687 142,838 264,500 42,355 Loss 1951 253,046 259,798 109,883 11,431 23,238 158,580 . 303,132 43,333 Loss 1952 315,148 322,267 104,306 12,977 25,905 158,580 301,769 20,498 * Represent charges by the Union Pacific Railroad. # Before federal income taxes. The reports quoted above were filed with the Public Service Commission of Nevada for rate-determining purposes. 3.3 The District proposes to increase water rates, follows; Estimated Est. Number Average Annual Service Population of Services Water Bill Annual Revenue 1954 40,000 (/12^500^ $ ([937,500) 1955 55,000 17,200 75 1,290,000 1956 57,200 17,900 75 1,342,500 1957 59,400 18,500 75 1,387,500 1958 61,600 19,200 67.50 1,296,000 1959 63,800 19,900 67.50 1,343,250 1960 66,000 20,600 67.50 1,390* 500 1961 68,000 21,200 67.50 1,431,000 1962 70,000 21,900 67.50 1,478,250 1963 72,000 22,500 60 1,350,000 14

