Copyright & Fair-use Agreement
UNLV Special Collections provides copies of materials to facilitate private study, scholarship, or research. Material not in the public domain may be used according to fair use of copyrighted materials as defined by copyright law. Please cite us.
Please note that UNLV may not own the copyright to these materials and cannot provide permission to publish or distribute materials when UNLV is not the copyright holder. The user is solely responsible for determining the copyright status of materials and obtaining permission to use material from the copyright holder and for determining whether any permissions relating to any other rights are necessary for the intended use, and for obtaining all required permissions beyond that allowed by fair use.
Read more about our reproduction and use policy.
I agree.Information
Digital ID
Permalink
Details
More Info
Rights
Digital Provenance
Publisher
Transcription
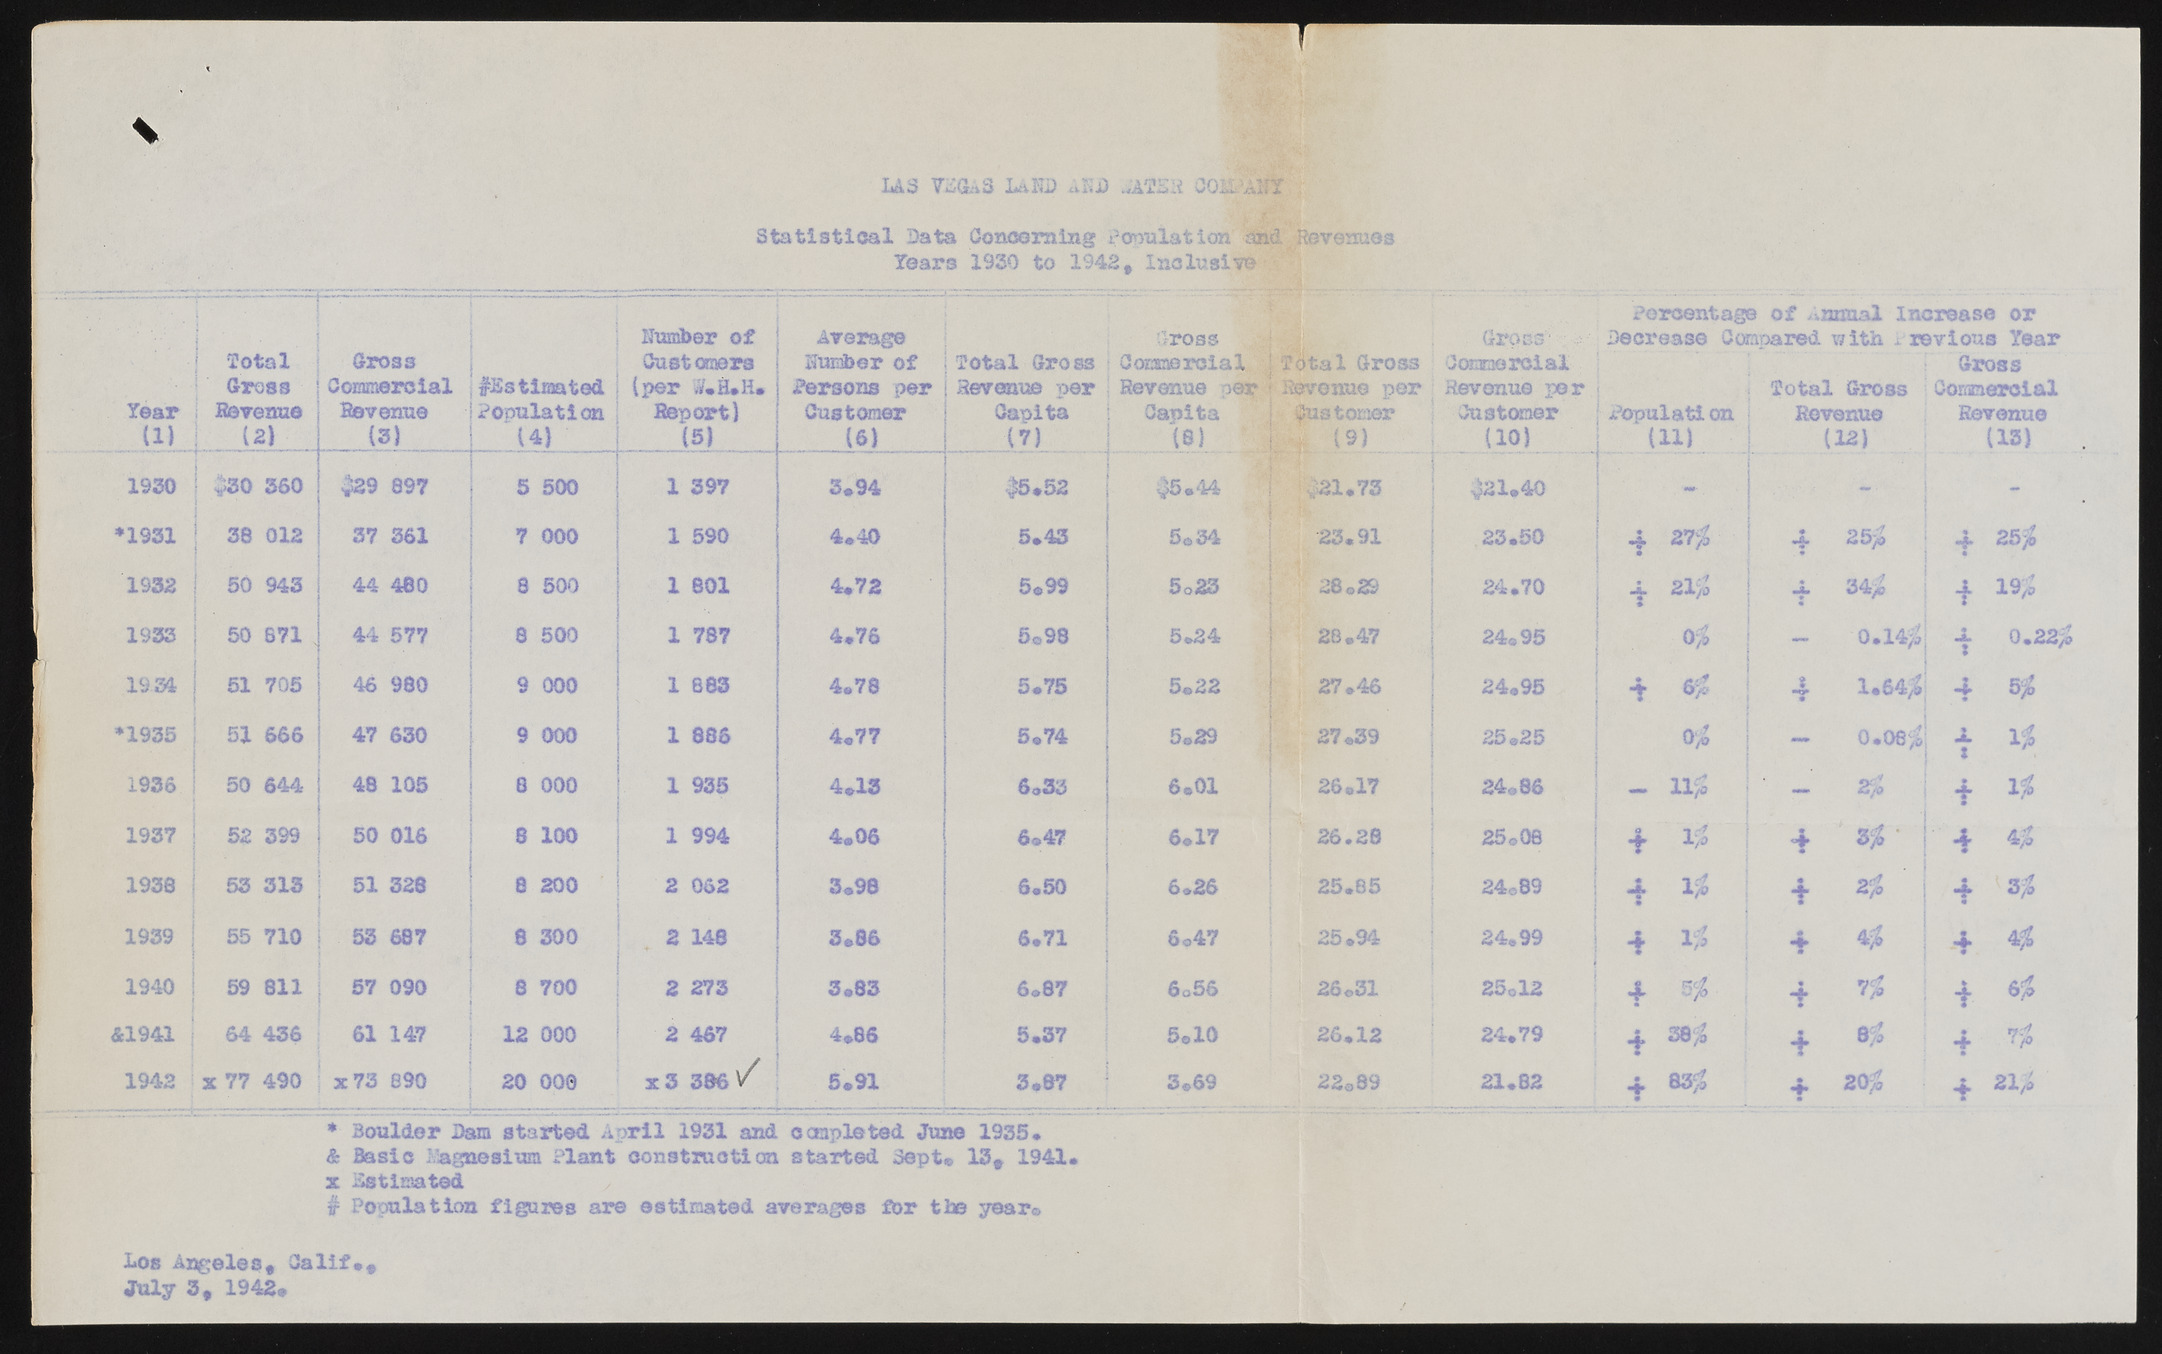
U S ViiSAS La III) AND UTSR 001 Statistical Data Concerning Population and Revenues Tears 1930 to 1942, Inclusive * & — Percentage of Number of Average ,.nnual Increase or Total Gross Customers Number of Total Gross Gross ? Decrease Comnared with. i xevious Year Gross Commercial i Total Gross Commercial Gross Year RGervoensuse CRoemvmeerncuieal PfoEpsutllamtaiteodn (per W.H.H. Persons per Revenue per Revenue per ? Revenue per Revenue per Total Gross Commercial Report) Customer Capita Capita Customer Customer Populati on Revenue Revenue (1) 12) (3) (4) (5) (6) (7) (8) M (9) (10} (11) (12) (135 1930 §30 360 §29 897 5 500 1 397 3*94 |5.52 §5.44 ! §21.73 §21.40 - *1931 38 012 37 361 7 000 1 590 4*40 5.43 34 23.91 23.50 0 •f• 27$ • 4 25$ 0 +• 25$ 1932 50 943 44 480 9 500 1 801 4.72 5.99 5o23 28.29 24.70 J•L 21$ A 34$ JTl 19$ 1933 50 871 44 577 8 500 1 787 4,76 5.98 5o24 28.47 24.95 0$ 0.14$j 0: 0.22$ 1934 51 705 46 980 9 000 1 B63 4.78 5.75 5.22 27.46 24.95 t« 6$ ?99e•* 1.64$ 4• 5$ *1935 51 666 47 630 9 000 1 886 4.77 5.74 5.29 27.39 25.25 0$ — 0.08$; • JLi 1$ 1936 50 644 48 105 8 000 1 935 4.13 6.33 6.01 26.17 24.86 — VAHH — 2$ 40 JL/b 1937 52 399 50 016 8 100 1 994 4.06 6.47 6.17 26.28 25*08 i 1$ • 4• 3$ ’ 4# 4$ 1938 53 313 51 326 8 200 2 062 3.98 6.50 6.26 25.85 24.89 «4w•»» 0 1$ i 2$ j 0 4 3$ 1939 55 710 53 687 9 300 2 148 3.86 6.71 6.47 25.94 24.99 i 4•* 4$ 4• 4$ 1940 59 811 57 090 8 700 2 273 3.83 6.87 6o56 26.31 25.12 4 Ofo j 0 40 §| 1 % t 6$ &1941 64 436 61 147 12 000 2 467 4.86 5.37 5.10 26,12 24.79 ?f 38$ 4 9$ 4 7$ 1942 x 77 490 x 73 890 20 006 x3 396 5.91 3.87 3.69 22.89 21.82 83$ 4 20$ 4 21$ * Boulder Dam started April 1931 and completed June 1935* & Basic Magnesium Plant construction started Sept* 13* 1941. x Estimated # Population figures are estimated averages fbr the year* Los Angeles* Calif July 3* 1942c

