Copyright & Fair-use Agreement
UNLV Special Collections provides copies of materials to facilitate private study, scholarship, or research. Material not in the public domain may be used according to fair use of copyrighted materials as defined by copyright law. Please cite us.
Please note that UNLV may not own the copyright to these materials and cannot provide permission to publish or distribute materials when UNLV is not the copyright holder. The user is solely responsible for determining the copyright status of materials and obtaining permission to use material from the copyright holder and for determining whether any permissions relating to any other rights are necessary for the intended use, and for obtaining all required permissions beyond that allowed by fair use.
Read more about our reproduction and use policy.
I agree.Information
Digital ID
Permalink
Details
More Info
Rights
Digital Provenance
Publisher
Transcription
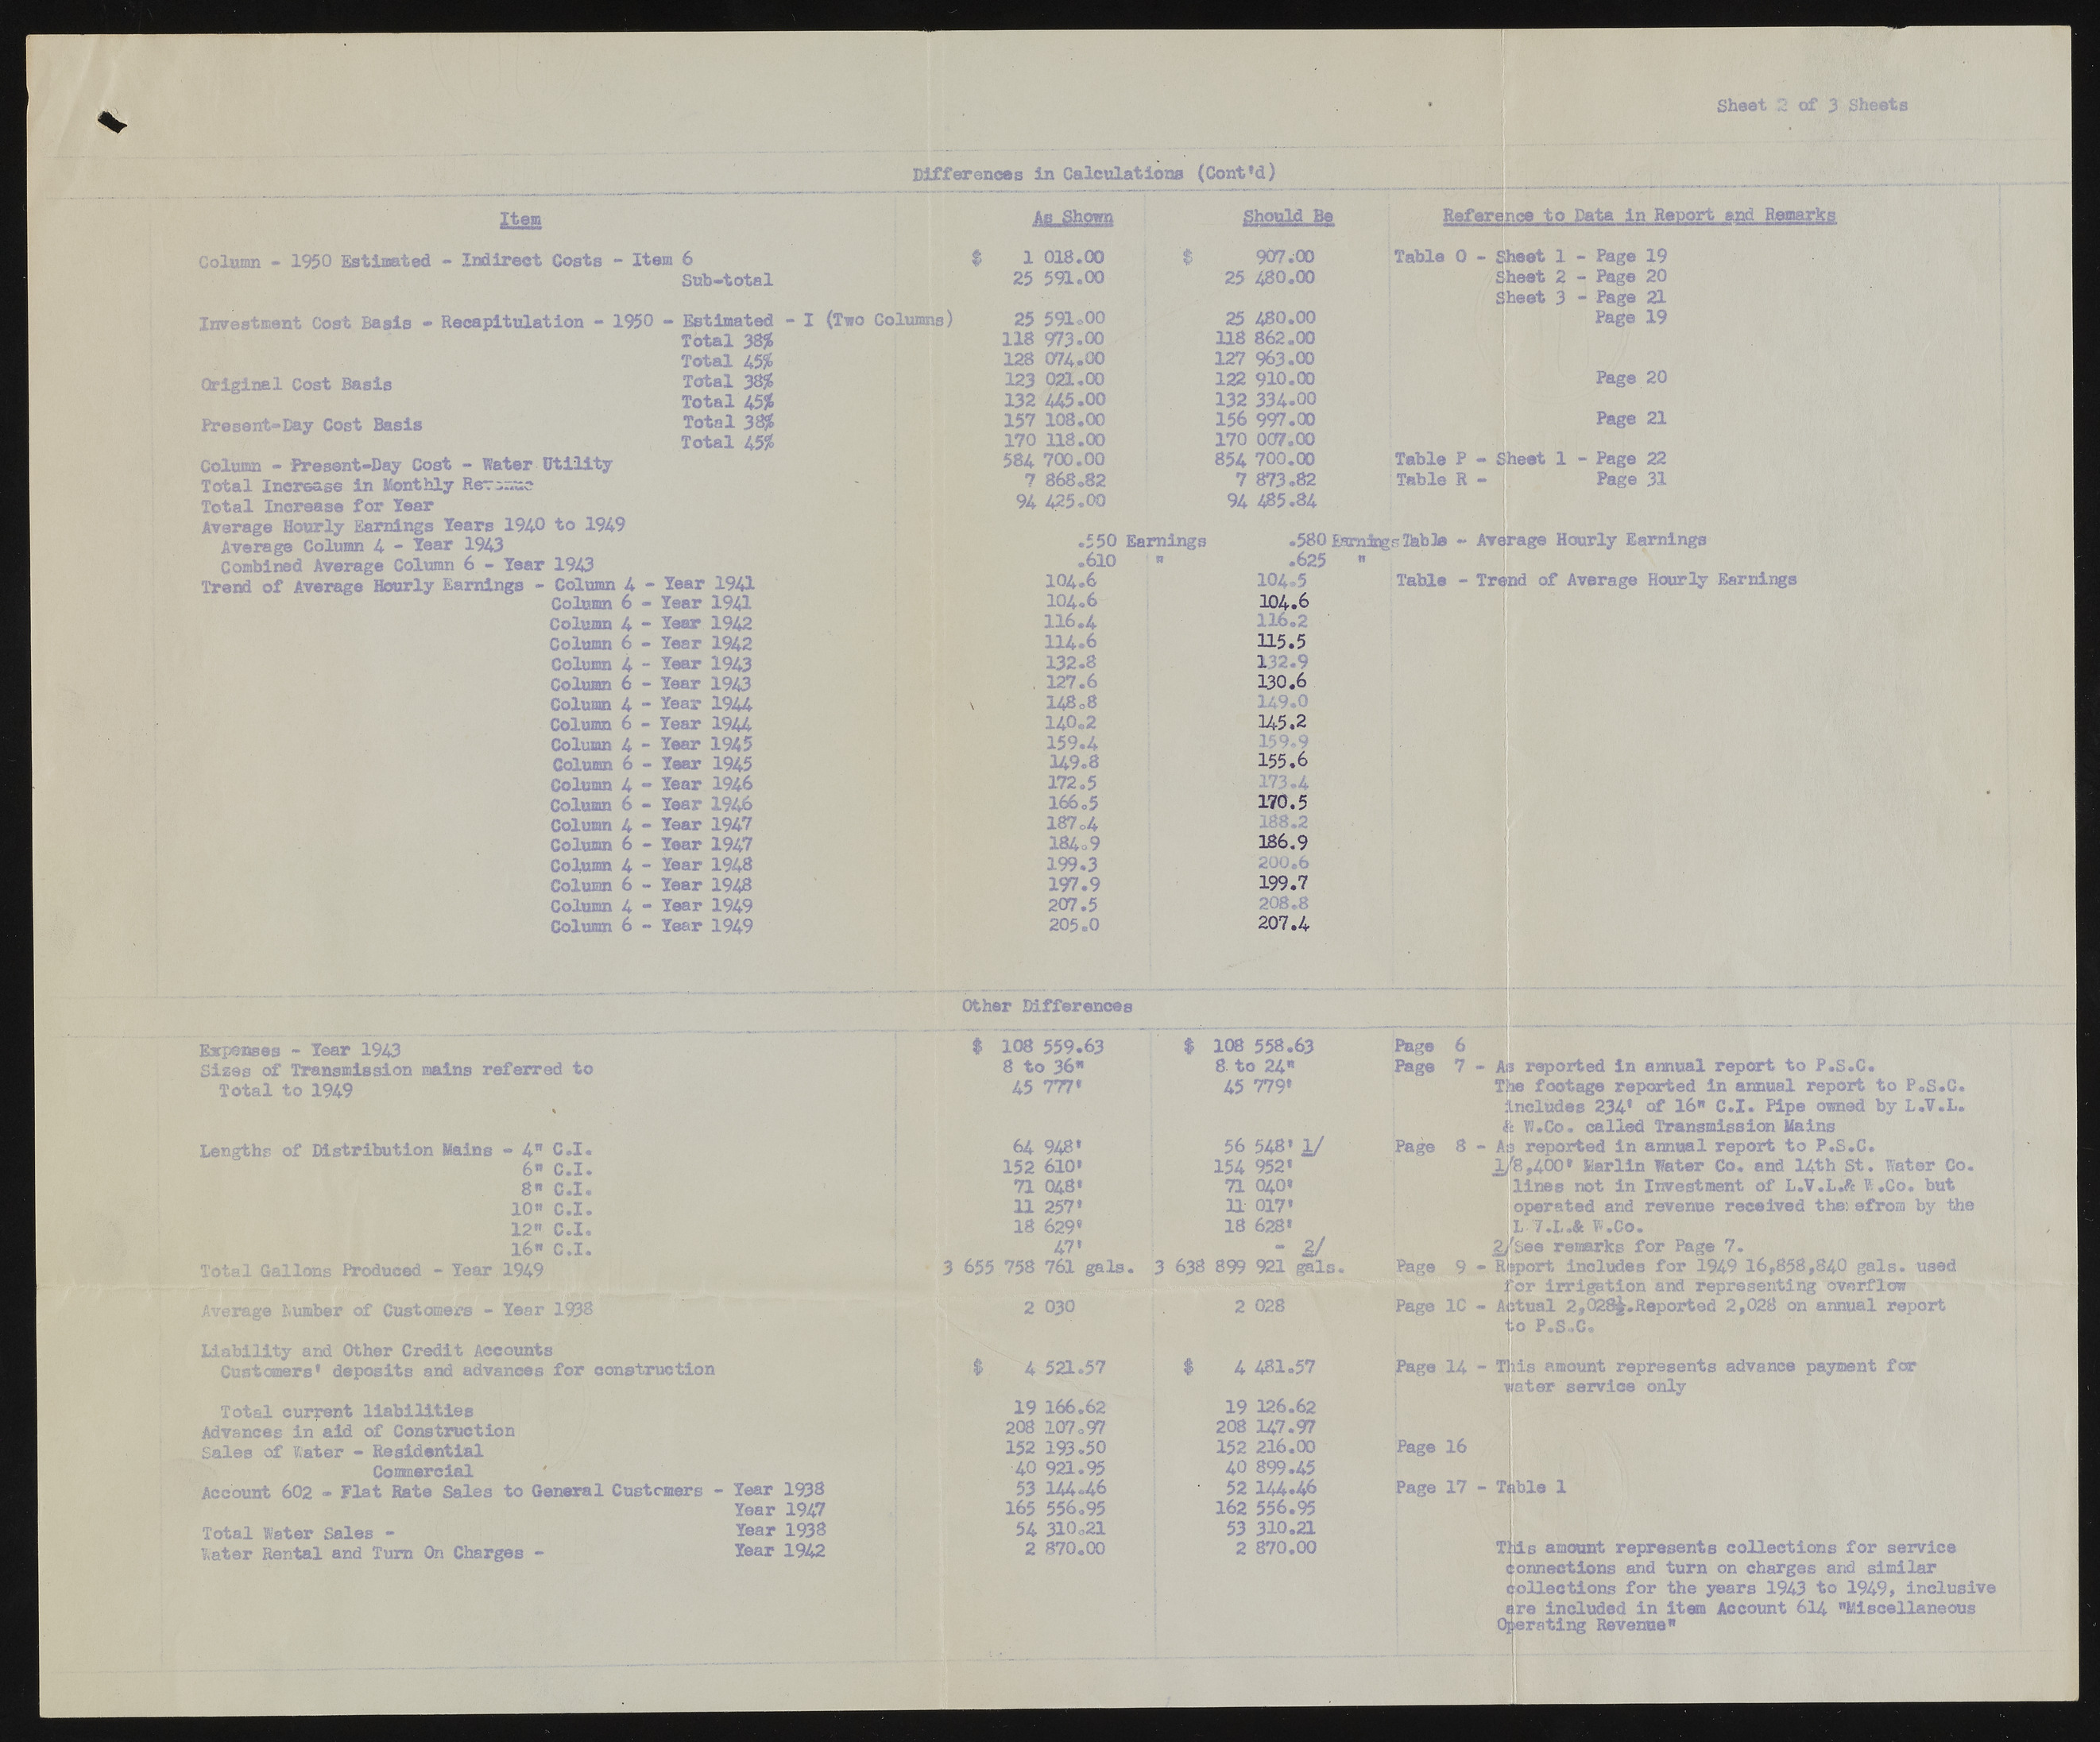
Sheet 2 of 3 Sheets Differences in Calculations (Cont'd) £tem Investment Cost Basis - Recapitulation - 1950 Original Cost Basis Present-Bay Cost Basis Column - Present-Day Cost - Water Utility Total Increase in Monthly Her:;r.ue Total Increase for Tear Average Hourly Earnings Tears 194-0 to 1949 Average Column 4 - Tear 1943 Combined Average Column 6 - Tear 1943 Trend of Average Hourly Earnings - Column 4 Column 6 Column 4 Column 6 Should Be Reference to Data in Report and Remarks 6 | 1 018.00 t 907.00 Sub-total 25 591.00 25 480.00 Estimated - I (Two Columns) 25 591.00 25 480.00 Total 38$ 118 973.00 118 862.00 Total 45$ 128 074*00 127 963.00 Total 38% 123 021.00 122 910.00 Total 45$ 132 445.00 132 334.00 Total 38$ 157 108.00 156 997.00 Total 45$ 170 118.00 170 007.00 584 700.00 854 700.00 1 7 868.82 7 873.82 94 425.00 94 485.84 Column Column Column Column Column Column Column Column Column Column Column Column Column Column 6 Tear Tear Tear Tear Tear Tear Tear Tear Tear Tear Tear Tear Tear Tear Tear Tear Tear Tear 19a 19a 1942 1942 1943 1943 1944 1944 1945 1945 1946 1946 1947 1947 1948 1948 1949 1949 Table 0 - Sheet 1 - Page 19 Sheet 2 - Page 20 Sheet 3 - Page 21 Page 19 Page 20 Page 21 Table P - Sheet 1 Table S - Page 22 Page 31 •550 Earnings .610 » 104.6 104.5 104.6 104.6 116.4 116.2 114*6 115.5 132.8 132.9 127.6 130.6 148.8 149.0 140.2 145.2 159.4 159.9 149.8 155.6 172.5 173.4 166.5 170.5 187.4 188.2 184.9 186.9 199.3 200.6 197.9 199.7 207.5 208.8 205.0 207.4 .580 liable - Average Hourly Earnings .625 * Table - Trend of Average Hourly Earnings Expenses - Tear 1943 Sizes of Transmission mains referred to Total to 1949 Lengths of Distribution Mains - 4 15 C.I. 6" C.I. 8" C.I. 10« C.I. 12" C.I. 16" C.I. Total Gallons Produced - Tear 1949 Average Lumber of Customers - Tear 1938 Liability and Other Credit Accounts Customers' deposits and advances for construction Total current liabilities Advances in aid of Construction Sales of Water - Residential Commercial Account 602 - Flat Rate Sales to General Customers - Tear 1938 Tear 1947 Total Water Sales - Tear 1938 Water Rental and Turn On Charges - Tear 1942 Other Differences $ 108 559.63 $ 108 558.63 Page 6 8 to 36" 8 to 24" Page 7 45 777* 45 779» 64 948' 56 548* 1/ Page 8 152 610* 154 952* 71 048* 71 Q40« 11 257» 11 017» 18 629* 18 628' 47* “ 2/ 758 761 gals. 3 638 899 921 gals. Page 9 2 030 2 028 Page 10 4 521.57 $ 4 481.57 Page 14 19 166.62 19 126.62 208 107.97 208 147.97 152 193.50 152 216.00 Page 16 40 921.95 40 899.45 53 144-46 52 144.46 Page 17 165 556.95 162 556.95 54 310.21 53 310.21 2 870.00 2 870.00 Ai'3 reported in annual report to P.S.C. The footage reported in annual report to P.S.C. includes 2341 of 16" C.I. Pipe owned by L.V.L. & W.Co. called Transmission Mains As reported in annual report to P.S.C. 2/8,400' Marlin Water Co. and 14th St. Water Co. lines not in Investment of L.V.L.& W.Co. but ^operated and revenue received the: efrosn by the 1 7 . 1 . 4 W.Co. 2/See remarks for Page 7. Report includes for 1949 16,858,840 gals, used for Irrigation and representing overflow Actual 2,028^.Reported 2,028 on annual report io P*Si.C. This amount represents advance payment for water service only - Table 1 iis amount represents collections for service connections and turn on charges and similar collections for the years 1943 to 1949, inclusive are included in item Account 614 "Miscellaneous Operating Revenue"

