Copyright & Fair-use Agreement
UNLV Special Collections provides copies of materials to facilitate private study, scholarship, or research. Material not in the public domain may be used according to fair use of copyrighted materials as defined by copyright law. Please cite us.
Please note that UNLV may not own the copyright to these materials and cannot provide permission to publish or distribute materials when UNLV is not the copyright holder. The user is solely responsible for determining the copyright status of materials and obtaining permission to use material from the copyright holder and for determining whether any permissions relating to any other rights are necessary for the intended use, and for obtaining all required permissions beyond that allowed by fair use.
Read more about our reproduction and use policy.
I agree.Information
Digital ID
Permalink
Details
More Info
Rights
Digital Provenance
Publisher
Transcription
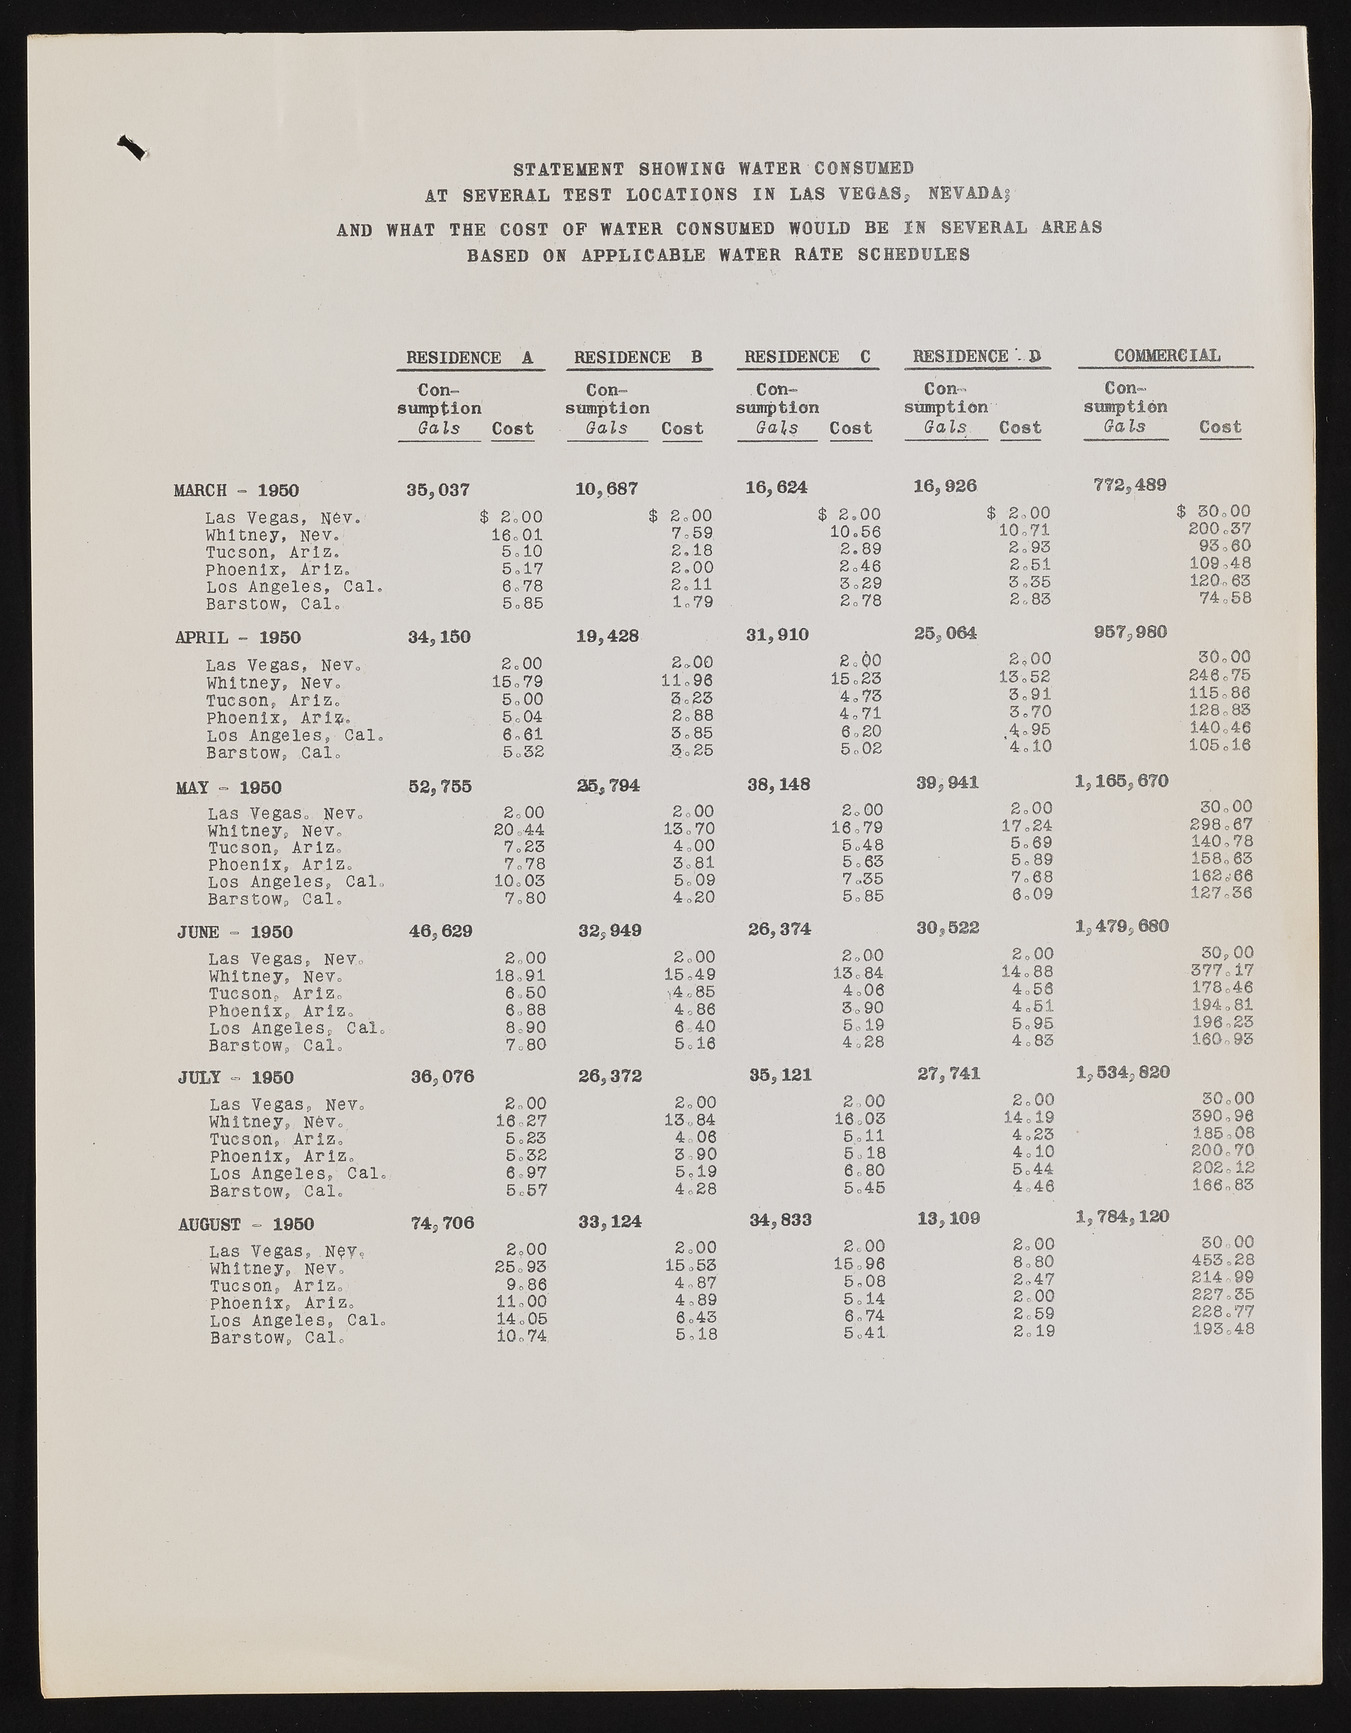
AND WHAT THE COST OF WATER CONSUMED WOULD BE IN SEVERAL AREAS BASED ON APPLICABLE WATER RATE SCHEDULES STATEM ENT SHOWING WATER CONSUMED AT S E V E R A L T E S T LO C A TIO N S IN LA S VEGAS* NEVADAf RESIDENCE A RESIDENCE B RESIDENCE C RESIDENCE D COMMERCIAL sumCpotnion G a ls Cost sumCpotnion G a ls Cost suCmpotnion G als Cost suCmopnt™ion G a l s Cost sumCpotnion G als Cost MARCH - 1950 35,037 10,687 16,624 16, 926 772,489 Las Ve.gas, Nev.' Cl 2.00 $ 2.00 $ 2.00 <l 2.00 $ 30.00 Whitney, Nev.< 16.01 7.59 10.56 10.71 200.37 Tucson, Aria. 5.10 2.18 2.89 2.93 93.60 phoenix, Arlz. 5.17 2.00 2.46 2,51 109.48 Los Angeles, Cal. 6.78 2.11 3.29 3.35 120.63 Barstow, Cal. 5.85 1.79 2.78 2.83 74,58 APRIL - 1950 34,150 19,428 31,910 25,064 957,980 Las Vegas, Nev. 2.00 2.00 8„0O 2,00 30.00 Whitney, Nev. 15.79 11.96 15.23 13.52 246.75 Tucson, Arlz. 5.00 3.23 4.73 3.91 115.86 Phoenix, Aria. 5.04 2.88 4.71 3.70 128o 85 Los Angeles,- Cal. 6.61 3.85 6.20 ,4,95 140o46 Barstow, Cal. . 5.52 3.25 5,02 4.10 105.16 MAY - 1950 52,755 25,794 38, 148 39,941 1,165,670 Las Vegas.. Nev. 2,00 2.00 2.00 2.00 30.00 Whitney, Nev. 20.44 13.70 16.79 17.24 298.67 Tucson, Arlz. 7.23 4,00 5.48 5.69 140,78 Phoenix, Arlz. 7.78 3,81 5.63 5.89 158.63 Los Angeles, Cal. 10.03 5.09 7.35 7.68 162.-66 Barstow, Cal. 7.80 4.20 5.85 6.09 127.36 JUNE - 1950 46,629 32,949 26,374 30,522 1,479,680 Las Vegas, Nev. 2.00 2,00 2.00 2,00 30p 00 Whitney, Nev. 18,91 15.49 13.84 14.88 377.17 Tucson, Arlz,. 6.50 v4.85 4.06 4.56 178.46 Phoenix, Arlz. 6.88 4,86 3.90 4.51 194.81 Los Angeles, Cal. 8.90 6,40 5.19 5.95 196.23 Barstow, Cal. 7.80 5,16 4,28 4.83 16Go 95 JULY - 1950 36,076 26,372 35,121 27, 741 1,534,820 Las Vegas, Nev. 2.00 2.00 2,00 2.00 30.00 Whitney, Nev. 16.27 13.84 16.03 m 19 590o 90 Tucson, Arlz. 5.23 4.06 5.11 4.23 185,08 Phoenix, Arlz. 5.32 3.90 5.18 4.10 200.70 Los Angeles, Cal. 6,97 5.19 6,80 5.44 202.12 Barstow, Cal. 5.57 4,28 5.45 4.46 166.83 AUGUST - 1950 74,706 33,124 34,833 13,109 1,784,120 Las Vegas, N$y, Whitney, Ne,v. Tucson, Arlz. 252..9030 9.86 125..0503 4,87 125..9060 5,08 28.,0800 2.47 43503,.0208 214.99 phoenix, Ariz. 11.00 4.89 5.14 2.00 227.35 Los Angeles, Cal, Barstow, Cal.' 1i04..7045, 56,.4138 56..7441 22,.5199 212983 oo 4787

