Copyright & Fair-use Agreement
UNLV Special Collections provides copies of materials to facilitate private study, scholarship, or research. Material not in the public domain may be used according to fair use of copyrighted materials as defined by copyright law. Please cite us.
Please note that UNLV may not own the copyright to these materials and cannot provide permission to publish or distribute materials when UNLV is not the copyright holder. The user is solely responsible for determining the copyright status of materials and obtaining permission to use material from the copyright holder and for determining whether any permissions relating to any other rights are necessary for the intended use, and for obtaining all required permissions beyond that allowed by fair use.
Read more about our reproduction and use policy.
I agree.Information
Digital ID
Permalink
Details
More Info
Rights
Digital Provenance
Publisher
Transcription
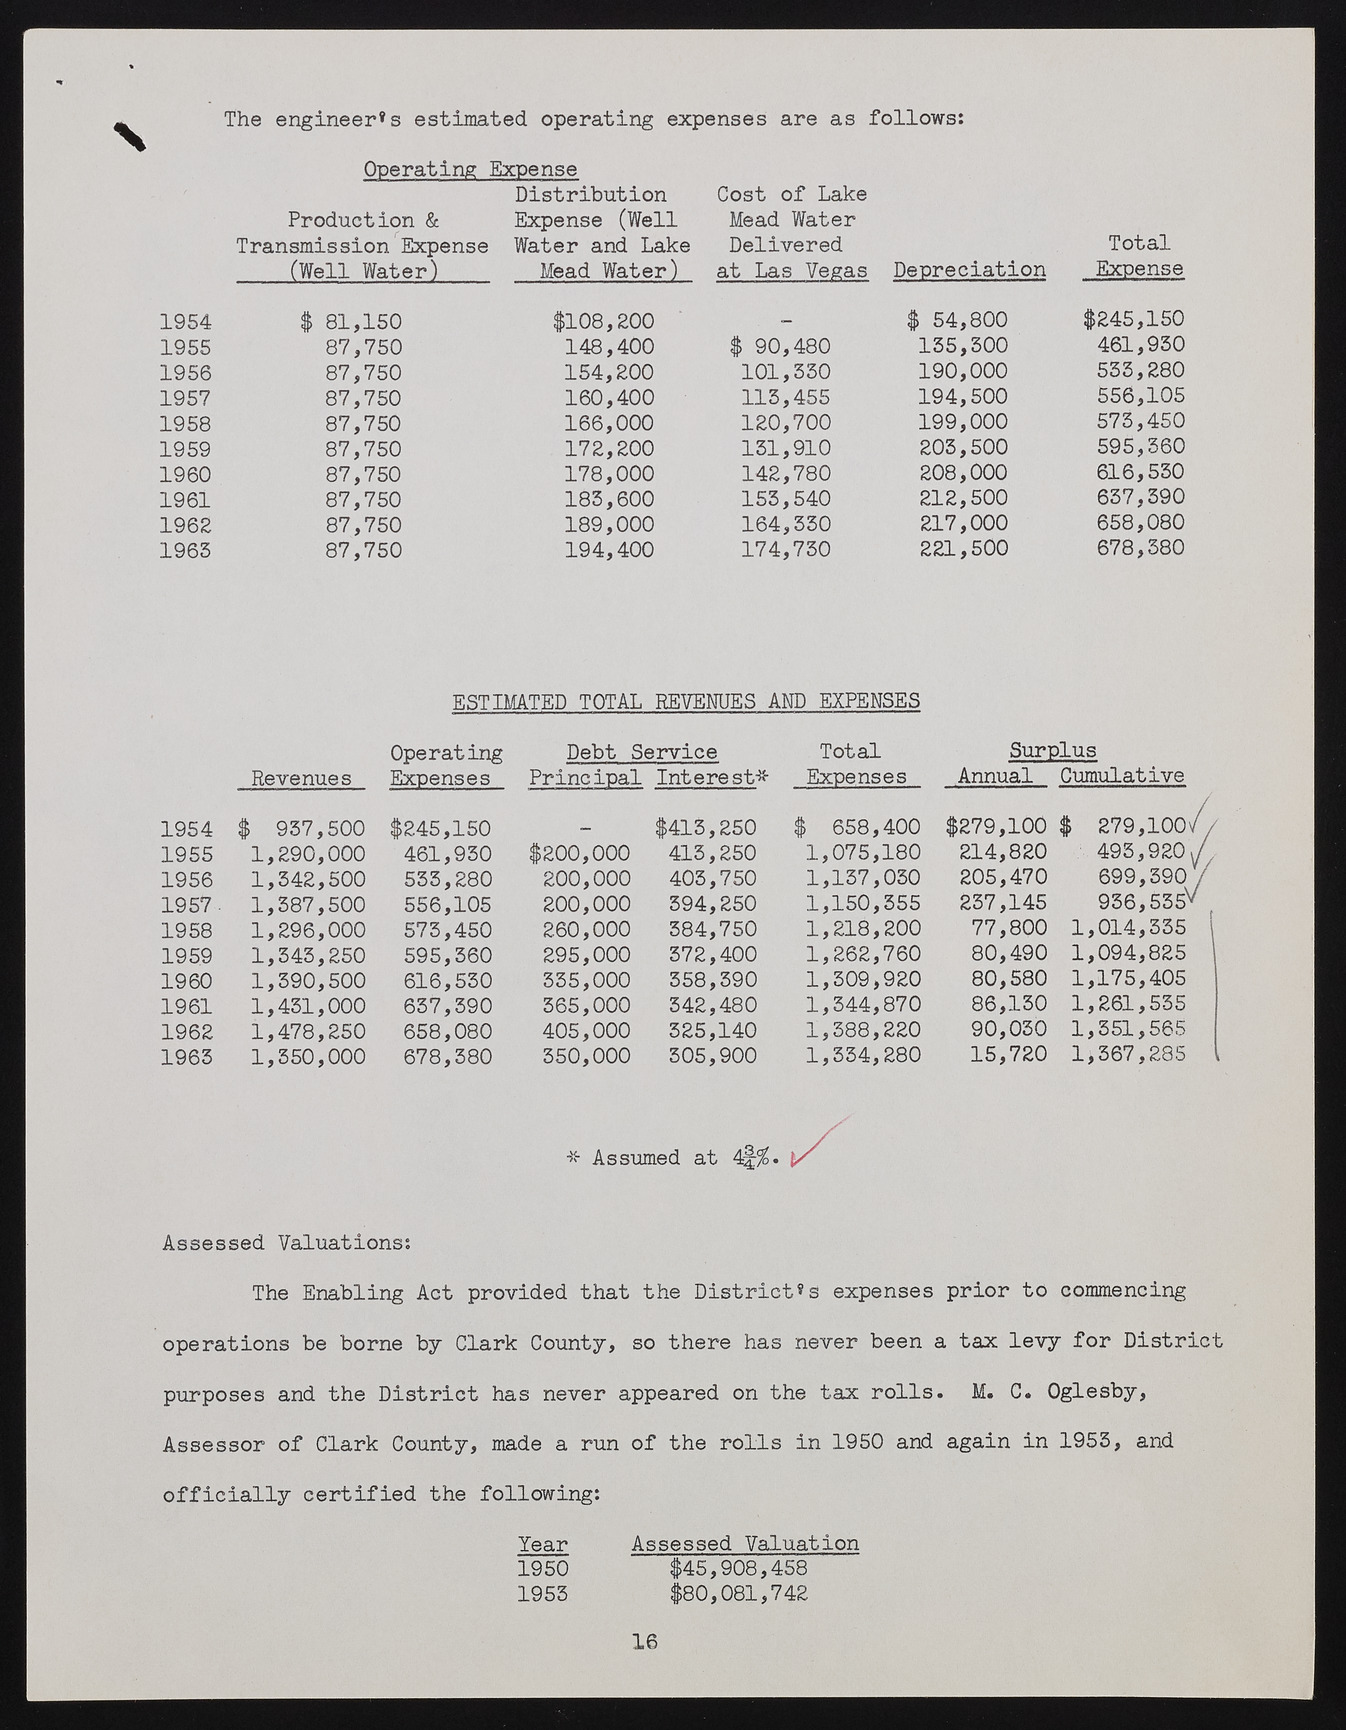
The engineer's estimated operating expenses are as follows: Operating Expense Distribution Cost of Lake Production & Expense (Well Mead Water Transmission Expense Water and Lake Delivered Total (Well Water) Mead Water) at Las Vegas Depreciation Expense 1954 $ 81,150 $108,200 _ $ 54,800 $245,150 1955 87,750 148,400 $ 90,480 135,300 461,930 1956 87,750 154,200 101,330 190,000 533,280 1957 87,750 160,400 113,455 194,500 556,105 1958 87,750 166,000 120,700 199,000 573,450 1959 87,750 172,200 131,910 203,500 595,360 1960 87,750 178,000 142,780 208,000 616,530 1961 87,750 183,600 153,540 212,500 637,390 1962 87,750 189,000 164,330 217,000 658,080 1963 87,750 194,400 174,730 221,500 678,380 ESTIMATED TOTAL REVENUES AND EXPENSES Revenues Operating Expenses Debt Service Principal Interest* Total Expenses Surplus Annual Cumulative 1954 $ 937,500 $245,150 $413,250 $ 658,400 $279,100 $ 279,100// 1955 1,290,000 461,930 $200,000 413,250 1,075,180 214,820 495,920J, 1956 1,342,500 533,280 200,000 403,750 1,137,030 205,470 699,390/ 1957- 1,387,500 556,105 200,000 394,250 1,150,355 237,145 936,535^ 1958 1,296,000 573,450 260,000 384,750 1,218,200 77,800 1,014,335 l 1959 1,343,250 595,360 295,000 372,400 1,262,760 80,490 1,094,825 1 1960 1,390,500 616,530 335,000 358,390 1,309,920 80,580 1,175,405 1961 1,431,000 637,390 365,000 342,480 1,344,870 86,130 1,261,535 1962 1,478,250 658,080 405,000 325,140 1,388,220 90,030 1,351,565 1963 1,350,000 678,380 350,000 305,900 1,334,280 15,720 1>367,285 * Assumed at Assessed Valuations; The Enabling Act provided that the Districts expenses prior to commencing operations be borne by Clark County, so there has never been a tax levy for District purposes and the District has never appeared on the tax rolls. M. C. Oglesby, Assessor of Clark County, made a run of the rolls in 1950 and again in 1953, and officially certified the following: Year Assessed Valuation $45,908,458 $80,081,742 1950 1953 16

