Copyright & Fair-use Agreement
UNLV Special Collections provides copies of materials to facilitate private study, scholarship, or research. Material not in the public domain may be used according to fair use of copyrighted materials as defined by copyright law. Please cite us.
Please note that UNLV may not own the copyright to these materials and cannot provide permission to publish or distribute materials when UNLV is not the copyright holder. The user is solely responsible for determining the copyright status of materials and obtaining permission to use material from the copyright holder and for determining whether any permissions relating to any other rights are necessary for the intended use, and for obtaining all required permissions beyond that allowed by fair use.
Read more about our reproduction and use policy.
I agree.Information
Digital ID
Permalink
Details
More Info
Rights
Digital Provenance
Publisher
Transcription
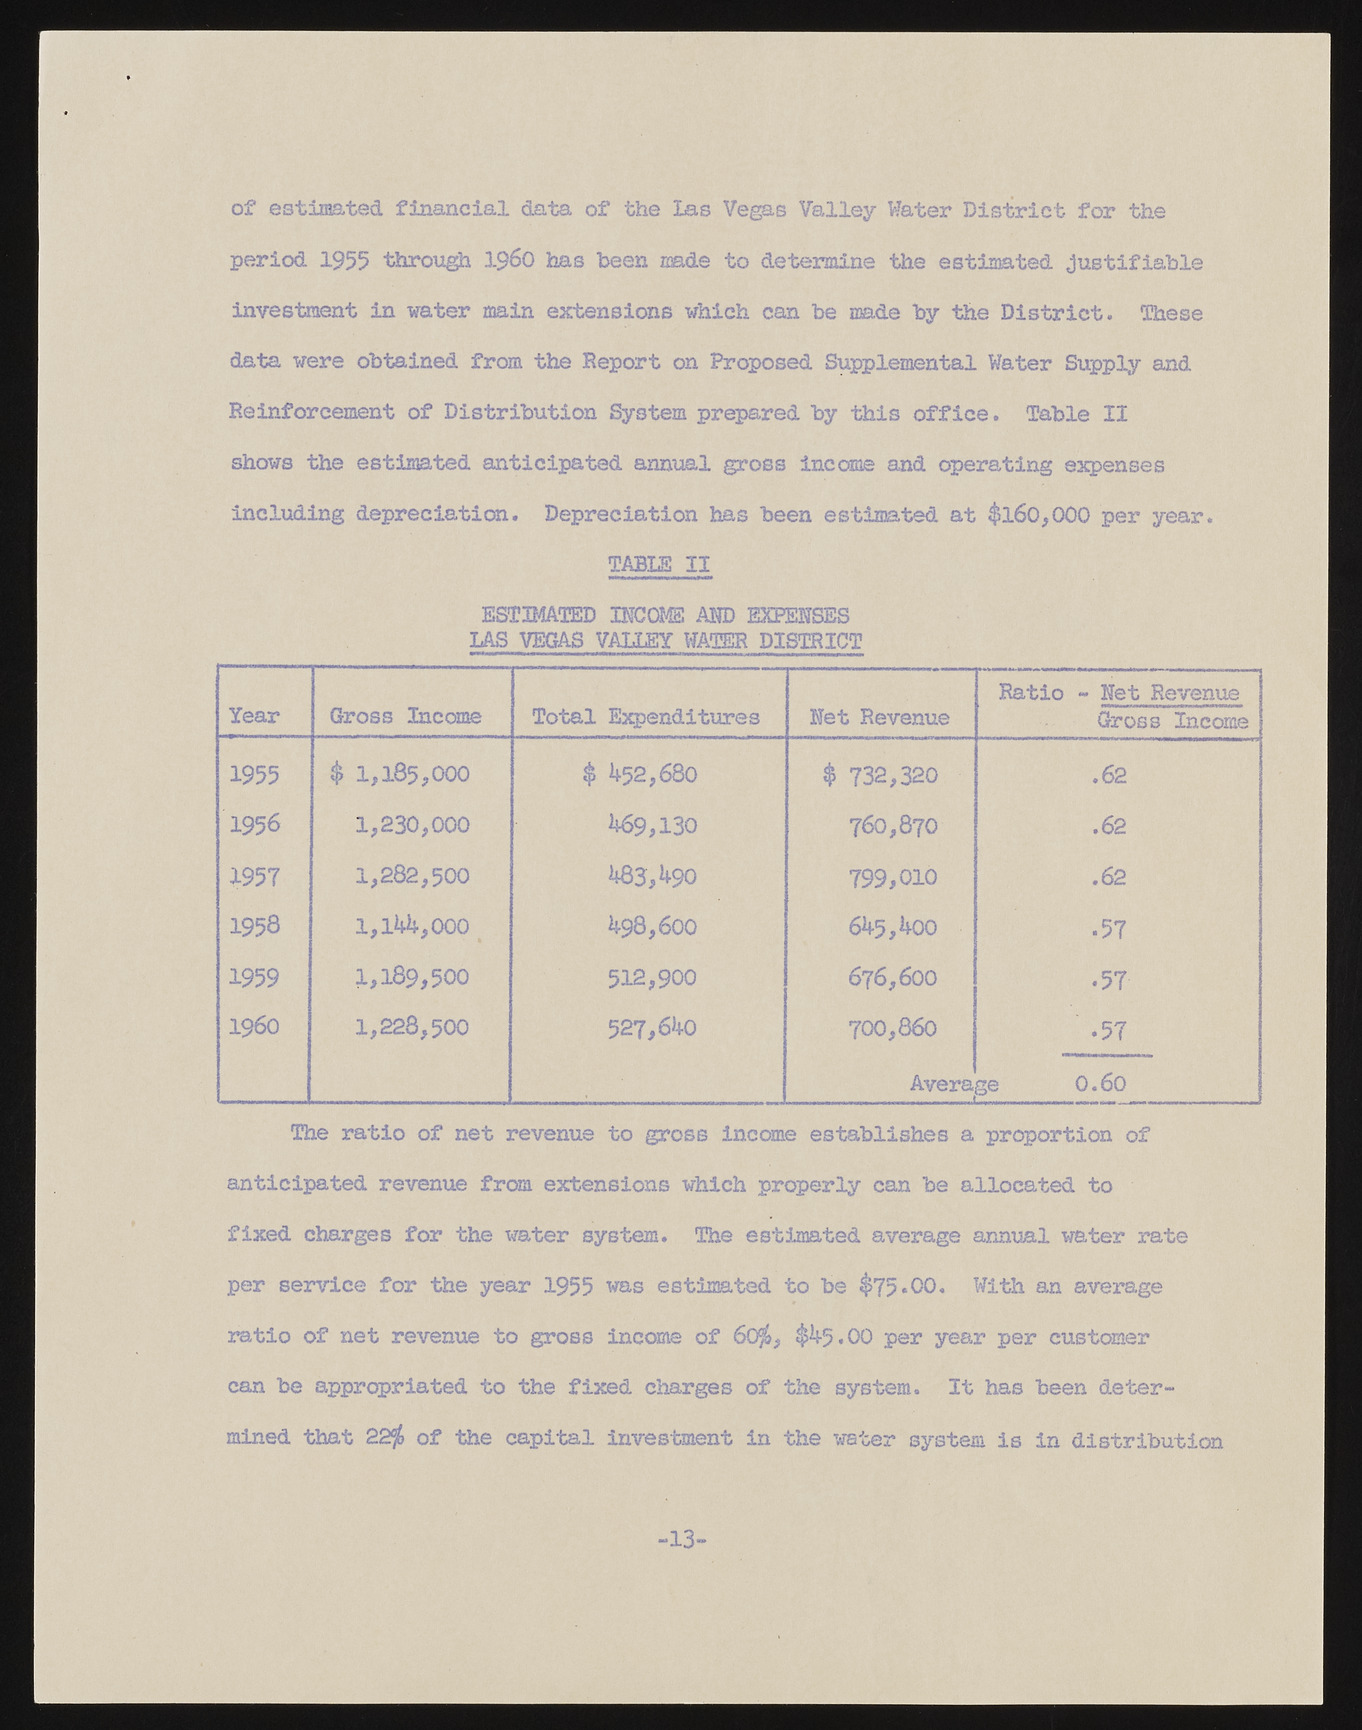
of estimated financial data of the las Vegas Valley Water District for the period 1955 through i960 has been made to determine the estimated justifiable investment in water main extensions which can be made by the District. These data were obtained from the Report on Proposed Supplemental Water Supply and Reinforcement of Distribution System prepared by this office. Table II shows the estimated anticipated annual gross income and operating expenses including depreciation. Depreciation has been estimated at $160,000 per year. TABLE II ESTIMATED INCOME AND EXPENSES LAS VEGAS VALLEY WATER DISTRICT Year Gross Income Total Expenditures Net Revenue Ratio - Net Revenue Gross Income 1955 $ 1,185,000 $ 452,680 $ 732,320 .62 1956 1,230,000 469,130 760,870 .62 1957 1,282,500 483,490 799,010 .62 1958 1,144,000 498,600 645,400 *57 1959 1,189,500 512,900 676,600 *57 i960 1,228,500 527,640 700,860 *57 ............ ..A...v..e..r..a. ge 0.60 The ratio of net revenue to gross income establishes a proportion of anticipated revenue from extensions which properly can be allocated to fixed charges for the water system. The estimated average annual water rate per service for the year 1955 was estimated to be $75*00. With an average ratio of net revenue to gross income of 60$, $45•00 per year per customer can be appropriated to the fixed charges of the system. It has been determined that 22$ of the capital investment in the water system is in distribution -13-

