Copyright & Fair-use Agreement
UNLV Special Collections provides copies of materials to facilitate private study, scholarship, or research. Material not in the public domain may be used according to fair use of copyrighted materials as defined by copyright law. Please cite us.
Please note that UNLV may not own the copyright to these materials and cannot provide permission to publish or distribute materials when UNLV is not the copyright holder. The user is solely responsible for determining the copyright status of materials and obtaining permission to use material from the copyright holder and for determining whether any permissions relating to any other rights are necessary for the intended use, and for obtaining all required permissions beyond that allowed by fair use.
Read more about our reproduction and use policy.
I agree.Information
Digital ID
Permalink
Details
Member of
More Info
Rights
Digital Provenance
Publisher
Transcription
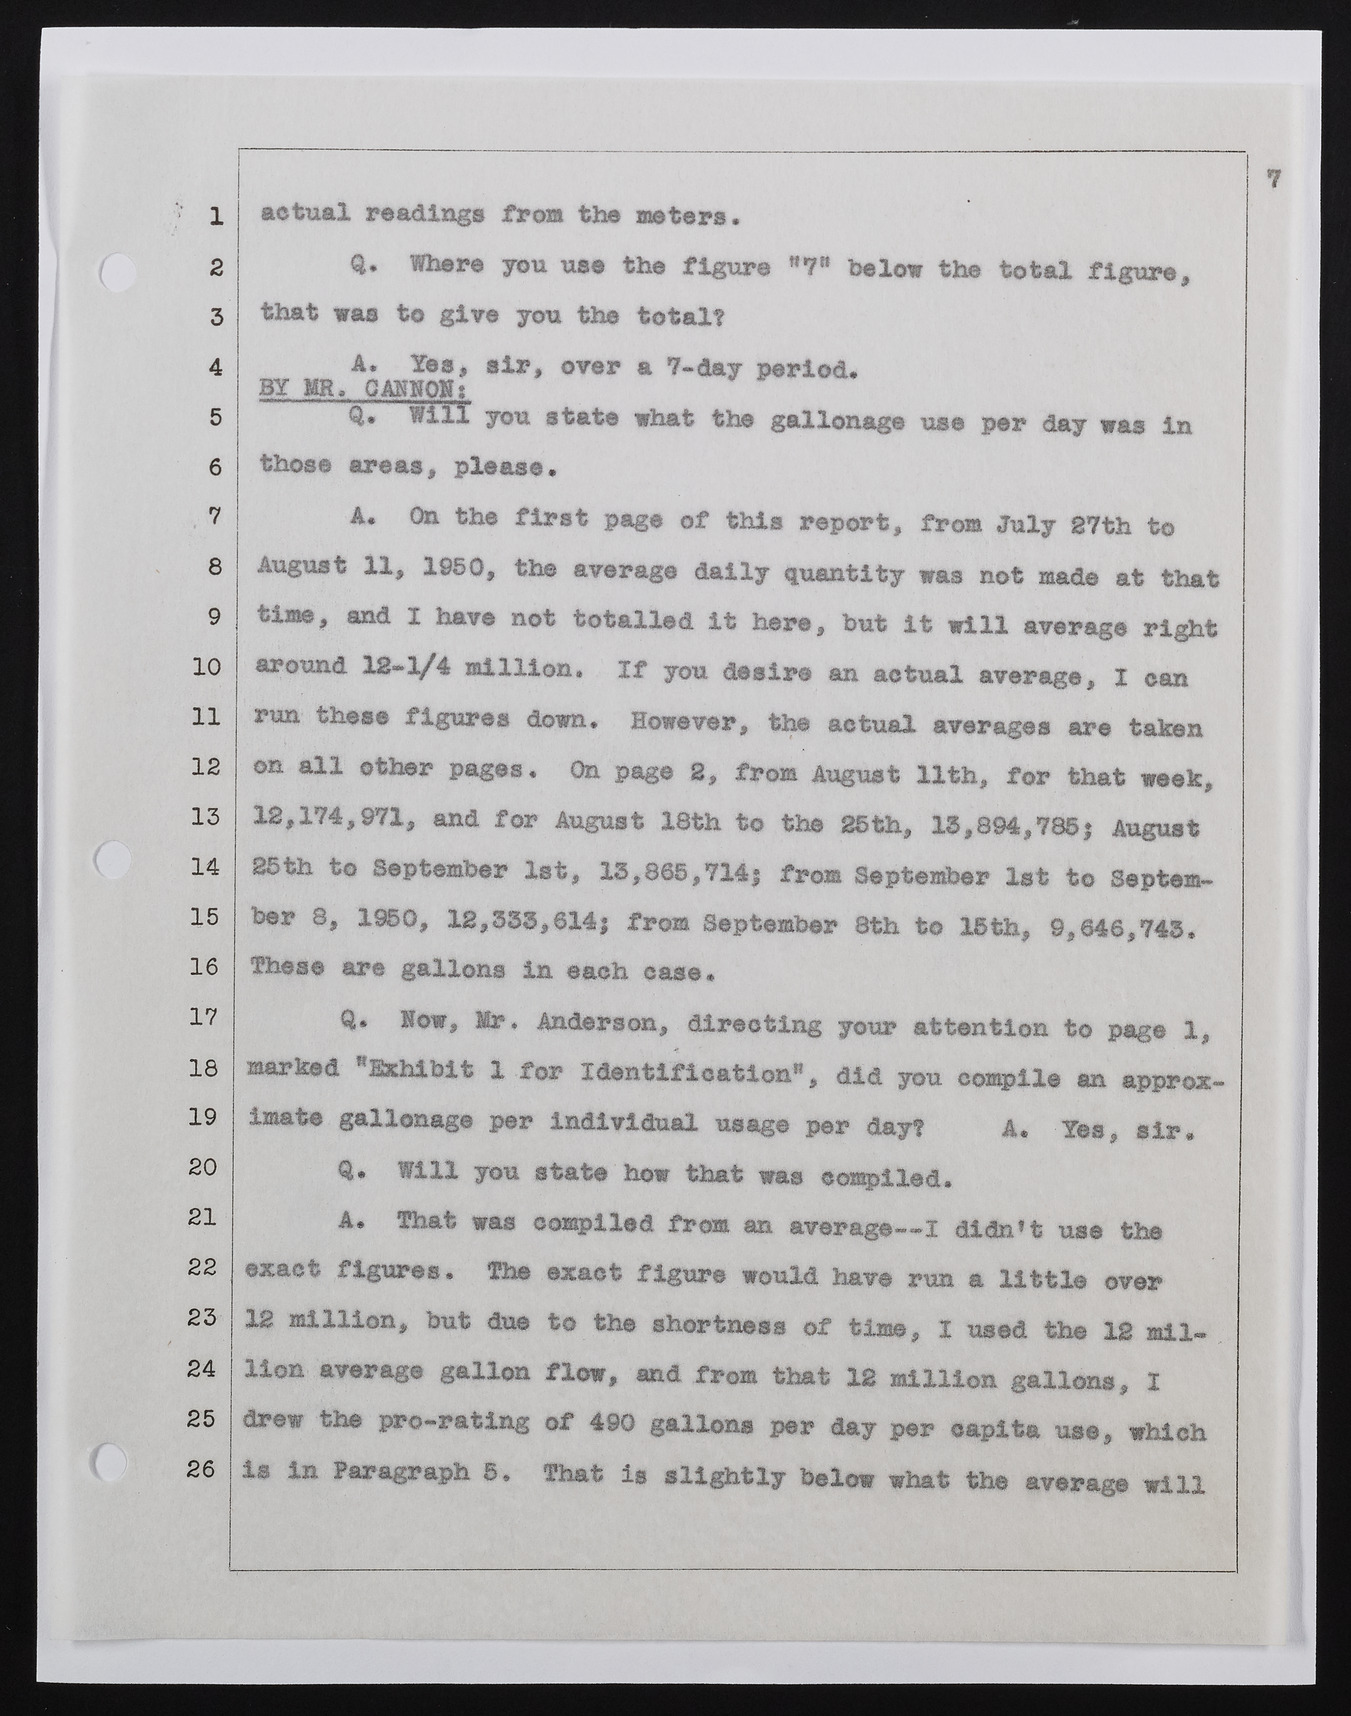
1 2 3 4 5 6 7 8 9 10 11 12 13 14 15 16 17 18 19 20 21 22 23 24 25 26 actual readings from the meters. Q. Where you use the figure w7» below the total figure, that was to give you the total? A. Yes, air, over a 7-day period. BY MR. CANKOKi "O* Will you state what the gallonage use per day was in those areas, please. A. On the first page of this report, from July 27th to August 11, 1950, the average daily quantity was not made at that time, and I have not totalled it here, but it will average right around 12-1/4 million. If you desire an actual average, I can run these figures down. However, the actual averages are taken on all other pages. On page 2, from August 11th, for that week, 12,174,971, and for August 18th to the 25th, 13,894,785$ August 25th to September 1st, 13,865,714; from September 1st to September 8, 1950, 12,333,614$ from September 8th to 15th, 9,646,743. These are gallons in each case. Q. How, Mr. Anderson, directing your attention to page 1, marked "Exhibit 1 for Identification", did you compile an approximate gallonage per individual usage per day? A. Yes, sir. Q. Will you state how that was compiled. A. That was compiled from an average—I didn’t use the exact figures. The exact figure would have run a little over 12 million, but due to the shortness of time, | used the 12 million average gallon flow, and from that 12 million gallons, I drew the pro-rating of 490 gallons per day per capita use, which is in Paragraph 5. That is slightly below what the average will

