Copyright & Fair-use Agreement
UNLV Special Collections provides copies of materials to facilitate private study, scholarship, or research. Material not in the public domain may be used according to fair use of copyrighted materials as defined by copyright law. Please cite us.
Please note that UNLV may not own the copyright to these materials and cannot provide permission to publish or distribute materials when UNLV is not the copyright holder. The user is solely responsible for determining the copyright status of materials and obtaining permission to use material from the copyright holder and for determining whether any permissions relating to any other rights are necessary for the intended use, and for obtaining all required permissions beyond that allowed by fair use.
Read more about our reproduction and use policy.
I agree.Information
Digital ID
Permalink
Details
More Info
Rights
Digital Provenance
Publisher
Transcription
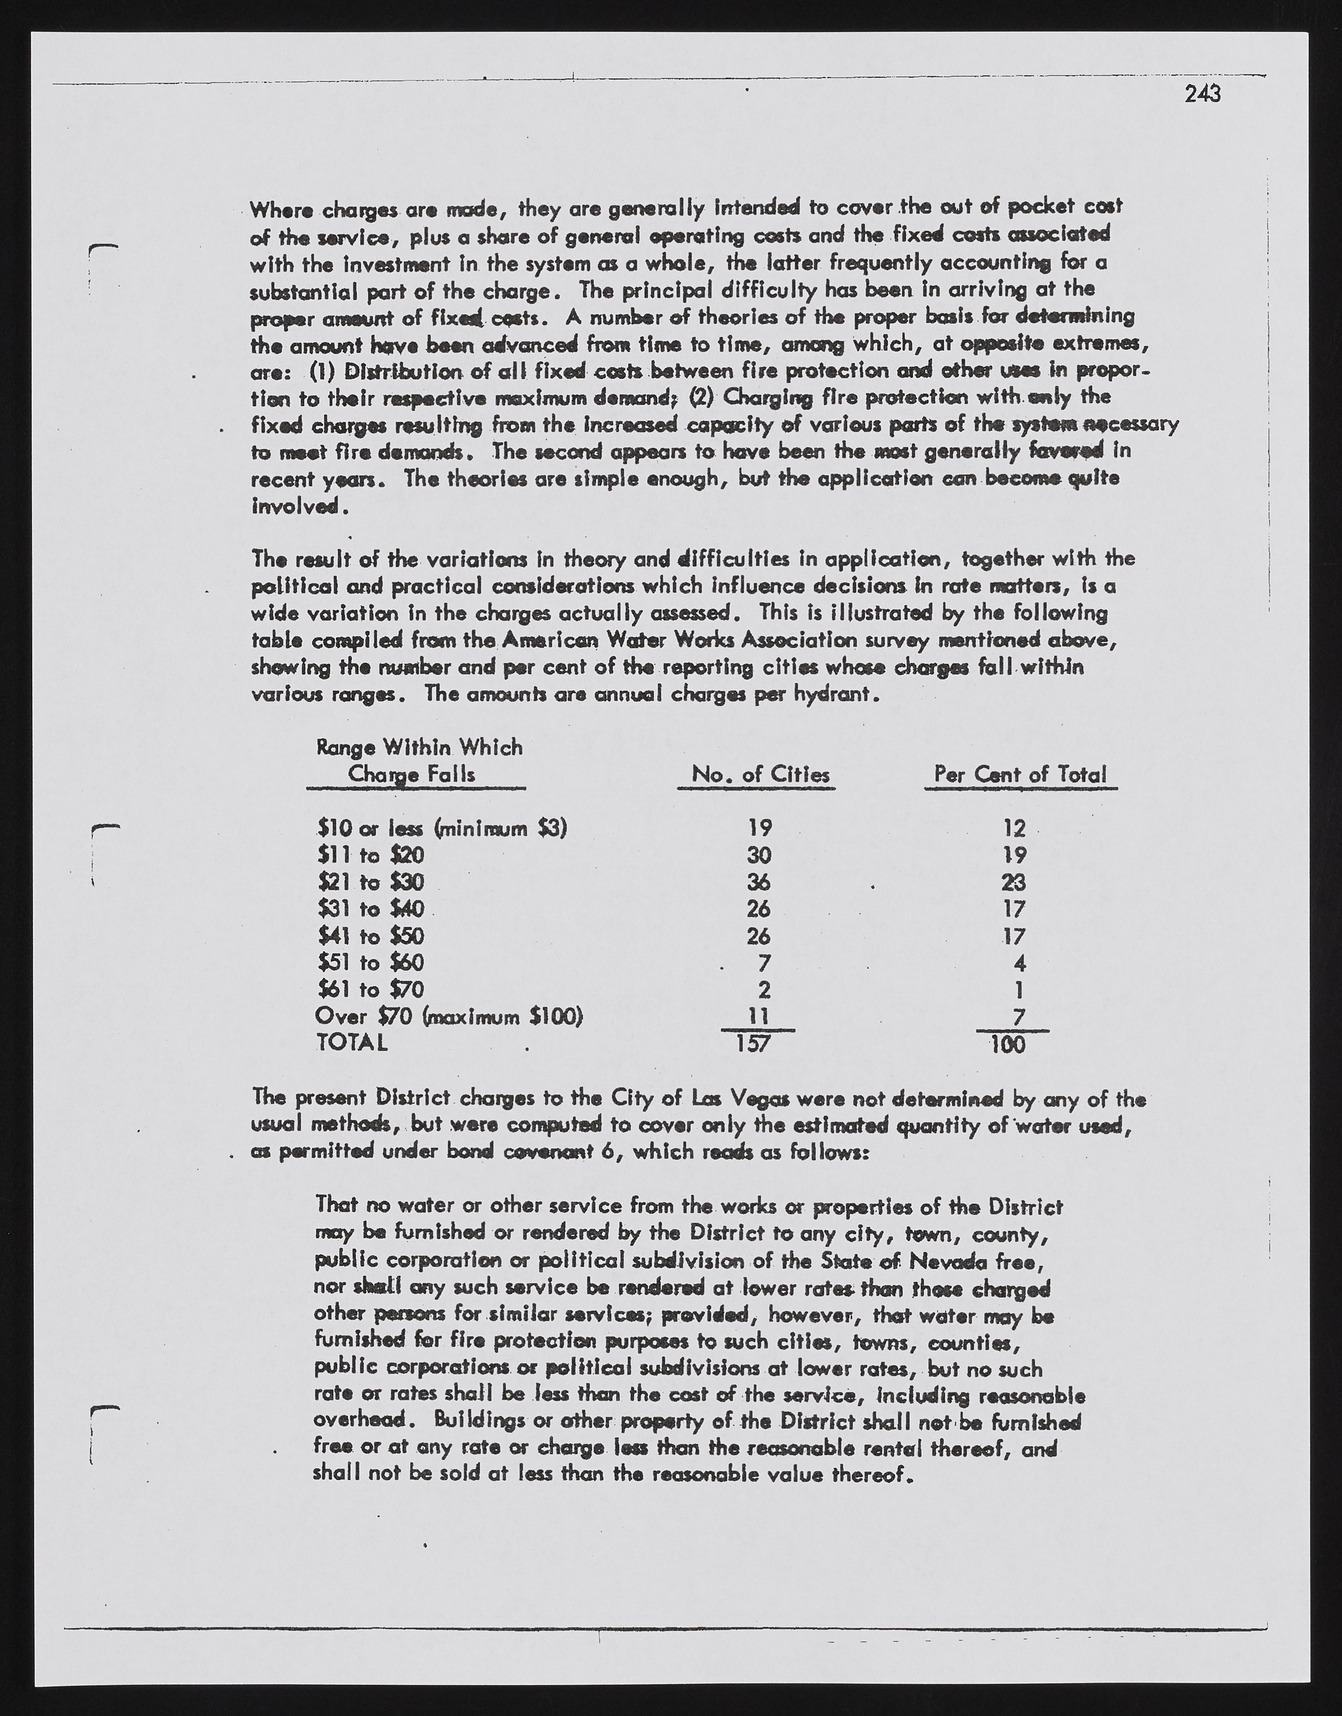
2 4 3 Where charges arc mode, they are generally Intended to cover the out of pocket cost of the service, plus a shore of general operating costs and the fixed costs associated with the investment in the system as a whole, the latter frequently accounting for a substantial part of the charge. The principal difficulty has been in arriving at the proper amount of fixed costs. A number of theories of the proper basis for determining the amount have been advanced from time to tim e, among w hich, at opposite extremes, are: (1) Distribution of al I fixed costs between fire protection mid other uses in proportion to their respective maximum demand? (2) Charging fire protection with oniy the fixed charges resulting from the Increased capacity of various parts of tho system necessary to meet fire demands. The second appears to have been the most generally favored In recent y e a n . The theories are simple enough, but the application can become quite involved. The result of the variations In theory and difficulties in application, together with the political and practical considerations which influence decisions in rate matters, is a wide variation in the charges actually assessed. This is illustrated by the following table compiled from the: American Water Works Association survey mentioned above, shewing the number and per cent of the reporting citios whose charges fall within various ranges. The amounts are annua! charges per hydrant. Range W ithin Which Charge Fails N o . of Cities Per Cent of Total $10 or ie a (minimum $3) 19 12 $11 to $20 30 19 $21 to $30 36 23 $31 to $40 26 17 $41 to $50 26 17 $51 to $60 7 4 $61 to $70 2 1 O v e r $70 (maximum $100) 11 7 T O T A L 157 100 The present District charges to the C ity of Las Vegas were not determined by any of the usual methods, but were computed to cover only the estimated quantity of water used, as permitted under bond covenant 6 , which reads as follows: That no water or other service from the works or properties of the District may be furnished or rendered by the District to any c ity , town, county, public corporation or political subdivision of the State of Nevada free, nor shall any such service be rendered at lower rates-than these charged other persons for similar services; provided, however, that water may be furnished for fir# protection purposes to such citios, towns, counties, public corporations or political subdivisions at lower rates, but no such rate or rates shall be less than the cost of the service, including reasonable overhead. Bui Idings or other property of the District shalI net be furnished free or at any rate or charge lea than the reasonable rental thereof, and shall not be sold at leu than the reasonable value thereof.

