Copyright & Fair-use Agreement
UNLV Special Collections provides copies of materials to facilitate private study, scholarship, or research. Material not in the public domain may be used according to fair use of copyrighted materials as defined by copyright law. Please cite us.
Please note that UNLV may not own the copyright to these materials and cannot provide permission to publish or distribute materials when UNLV is not the copyright holder. The user is solely responsible for determining the copyright status of materials and obtaining permission to use material from the copyright holder and for determining whether any permissions relating to any other rights are necessary for the intended use, and for obtaining all required permissions beyond that allowed by fair use.
Read more about our reproduction and use policy.
I agree.Information
Digital ID
Permalink
Details
More Info
Rights
Digital Provenance
Publisher
Transcription
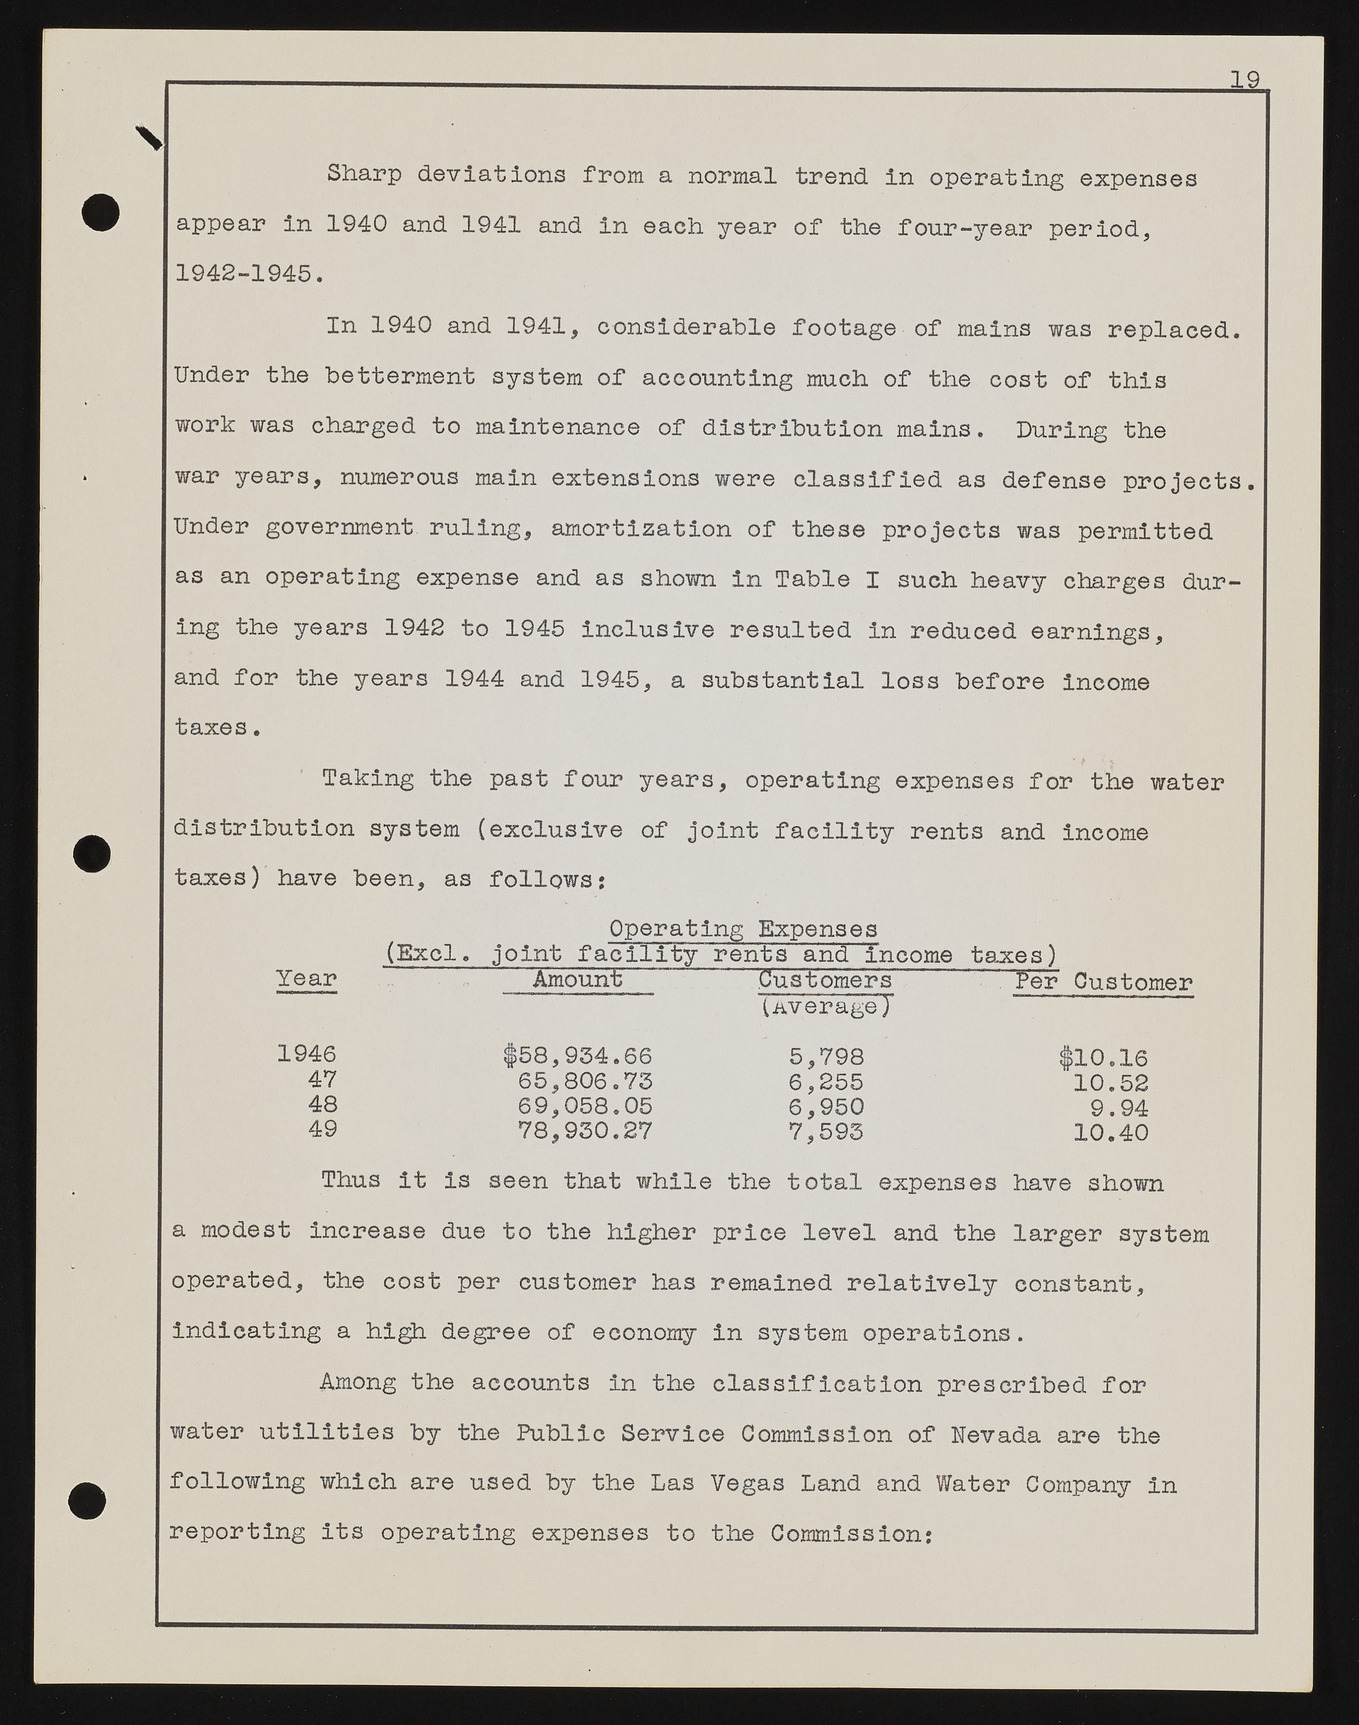
19 X Sharp deviations from a normal trend in operating expenses appear in 1940 and 1941 and in each year of the four-year period, 1942-1945. In 1940 and 1941, considerable footage of mains was replaced. Under the betterment system of accounting much of the cost of this work was charged to maintenance of distribution mains. During the war years, numerous main extensions were classified as defense projects. Under government ruling, amortization of these projects was permitted as an operating expense and as shown in Table I such heavy charges during the years 1942 to 1945 inclusive resulted in reduced earnings, and for the years 1944 and 1945, a substantial loss before income taxes. Taking the past four years, operating expenses for the water distribution system (exclusive of joint facility rents and income taxes) have been, as follows: Operating Expenses (Excl. joint facility rents and income taxes) Year Amount Customers Per Customer 1946 $58,954.66 (Average) 5,798 4V $10.16 65,806.73 6,255 10.52 48 69,058.05 6,950 9.94 49 78,930.27 7,593 10.40 Thus it is seen that while the total expenses have shown a modest increase due to the higher price level and the larger system operated, the cost per customer has remained relatively constant, indicating a high degree of economy in system operations. Among the accounts in the classification prescribed for water utilities by the Public Service Commission of Nevada are the following which are used by the Las Vegas Land and Water Company in reporting its operating expenses to the Commission:

