Search the Special Collections and Archives Portal
Search Results
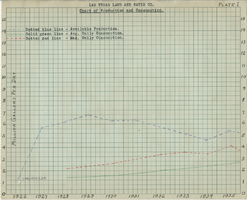
Chart of water production and consumption from the Las Vegas Land and Water Company, 1926-1944
Date
1926 to 1944
Archival Collection
Description
Chart showing the available production, average daily consumption, and the maximum daily consumption of water from 1926 to 1944
Text
Pagination
Refine my results
Content Type
Creator or Contributor
Subject
Archival Collection
Digital Project
Resource Type
Year
Material Type
Place
Language
Records Classification

