Copyright & Fair-use Agreement
UNLV Special Collections provides copies of materials to facilitate private study, scholarship, or research. Material not in the public domain may be used according to fair use of copyrighted materials as defined by copyright law. Please cite us.
Please note that UNLV may not own the copyright to these materials and cannot provide permission to publish or distribute materials when UNLV is not the copyright holder. The user is solely responsible for determining the copyright status of materials and obtaining permission to use material from the copyright holder and for determining whether any permissions relating to any other rights are necessary for the intended use, and for obtaining all required permissions beyond that allowed by fair use.
Read more about our reproduction and use policy.
I agree.Information
Digital ID
Permalink
Details
Member of
More Info
Rights
Digital Provenance
Publisher
Transcription
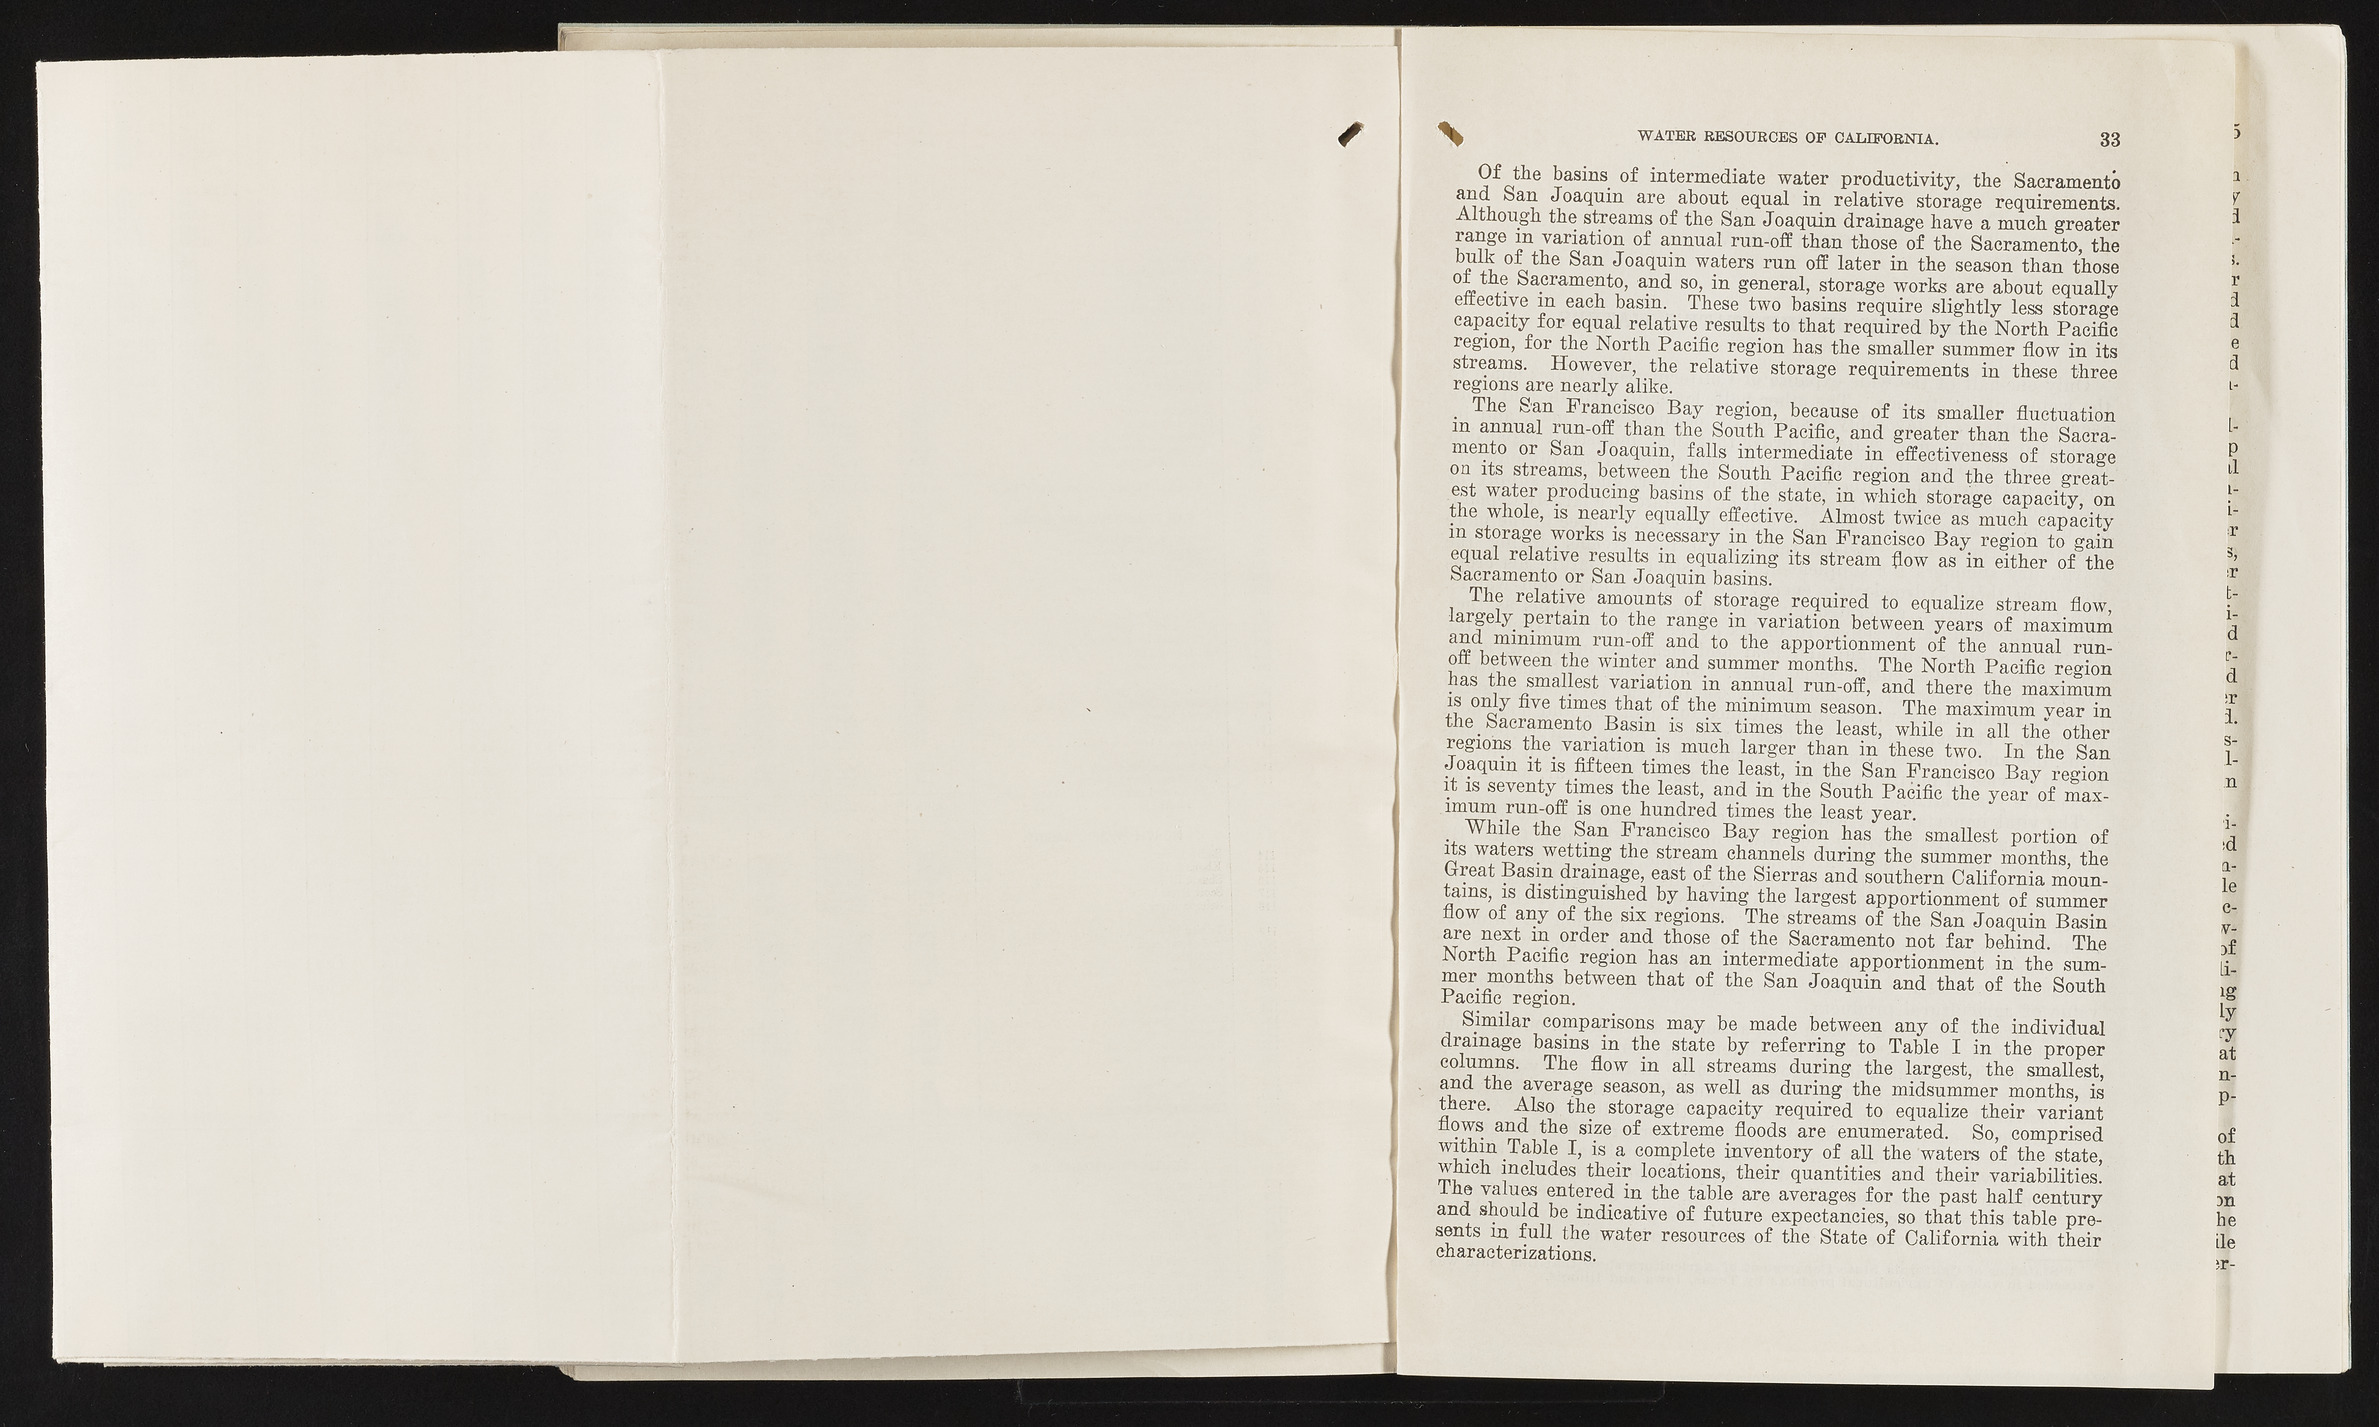
WATER RESOURCES OP CALIFORNIA. 33 Of the basins of intermediate water productivity, the Sacramento T i+l J °a<luin are about equal in relative storage requirements. Although the streams of the San Joaquin drainage have a much greater range m variation of annual run-off than those of the Sacramento, the f 7 ? °~L ®an Joaquiu waters run off later in the season than those °i, Sacramento, and so, in general, storage works are about equally effective in each basin. These two basins require slightly less storage capacity for equal relative results to that required by the North Pacific region, for the North Pacific region has the smaller summer flow in its streams. However, the relative storage requirements in these three regions are nearly alike. ,. The San Francisco Bay region, because of its smaller fluctuation ™ annual run-off than the South Pacific, and greater than the Sacramento or San Joaquin, falls intermediate in effectiveness of storage on its streams, between the South Pacific region and the three great- S P ili Producing basins of the state, in which storage capacity, on the whole, is nearly equally effective. Almost twice as much capacity m storage works is necessary in the San Francisco Bay region to gain equal relative results in equalizing its stream flow as in either of the Sacramento or San Joaquin basins. The relative amounts of storage required to equalize stream flow, largely pertain to the range in variation between years of maximum and minimum run-off and to the apportionment of the annual runoff between the winter and summer months. The North Pacific region has the smallest variation in annual run-off, and there the maximum is only five times that of the minimum season. The maximum vear in the _Saeramento_ Basin is six . times the least, while in all the other regions the_ variation is much larger than in these two. In the San Joaquin it is fifteen times, the least, in the San Francisco Bay region it is seventy times the least, and in the South Pacific the year of maximum run-off is one hundred times the least year. While the San Francisco Bay region has the smallest portion of its waters wetting the stream channels during the summer months the txreat Basin drainage, east of the Sierras and southern California mountains, is distinguished by having the largest apportionment of summer flow of any of the six regions. The streams of the San Joaquin Basin are next in order and those of the Sacramento not far behind. The North Pacific region has an intermediate apportionment in the sum-mer months between that of the San Joaquin and that of the South Pacific region. Similar comparisons may be made between any of the individual drainage basins in the state by referring to Table I in the proper columns. The flow in all streams during the largest, the smallest, aiid the average season, as well as during the midsummer months, is there. Also the storage capacity required to equalize their variant flows and the size of extreme floods are enumerated. So, comprised within Table I, is a Complete inventory of all the waters of the state, which includes their locations, their quantities and their variabilities, the values entered in the table are averages for the past half century and should be indicative of future expectancies, so that this table presents m full the water resources of the State o f California with their characterizations. P il s 1 H 3) . ir || i-d ei-d :r ? Sr'l 1 1- id ajj le c-,mi f ? ig ly ry at n- P-of th at m he ile ;r-

