Copyright & Fair-use Agreement
UNLV Special Collections provides copies of materials to facilitate private study, scholarship, or research. Material not in the public domain may be used according to fair use of copyrighted materials as defined by copyright law. Please cite us.
Please note that UNLV may not own the copyright to these materials and cannot provide permission to publish or distribute materials when UNLV is not the copyright holder. The user is solely responsible for determining the copyright status of materials and obtaining permission to use material from the copyright holder and for determining whether any permissions relating to any other rights are necessary for the intended use, and for obtaining all required permissions beyond that allowed by fair use.
Read more about our reproduction and use policy.
I agree.Information
Digital ID
Permalink
Details
Member of
More Info
Rights
Digital Provenance
Publisher
Transcription
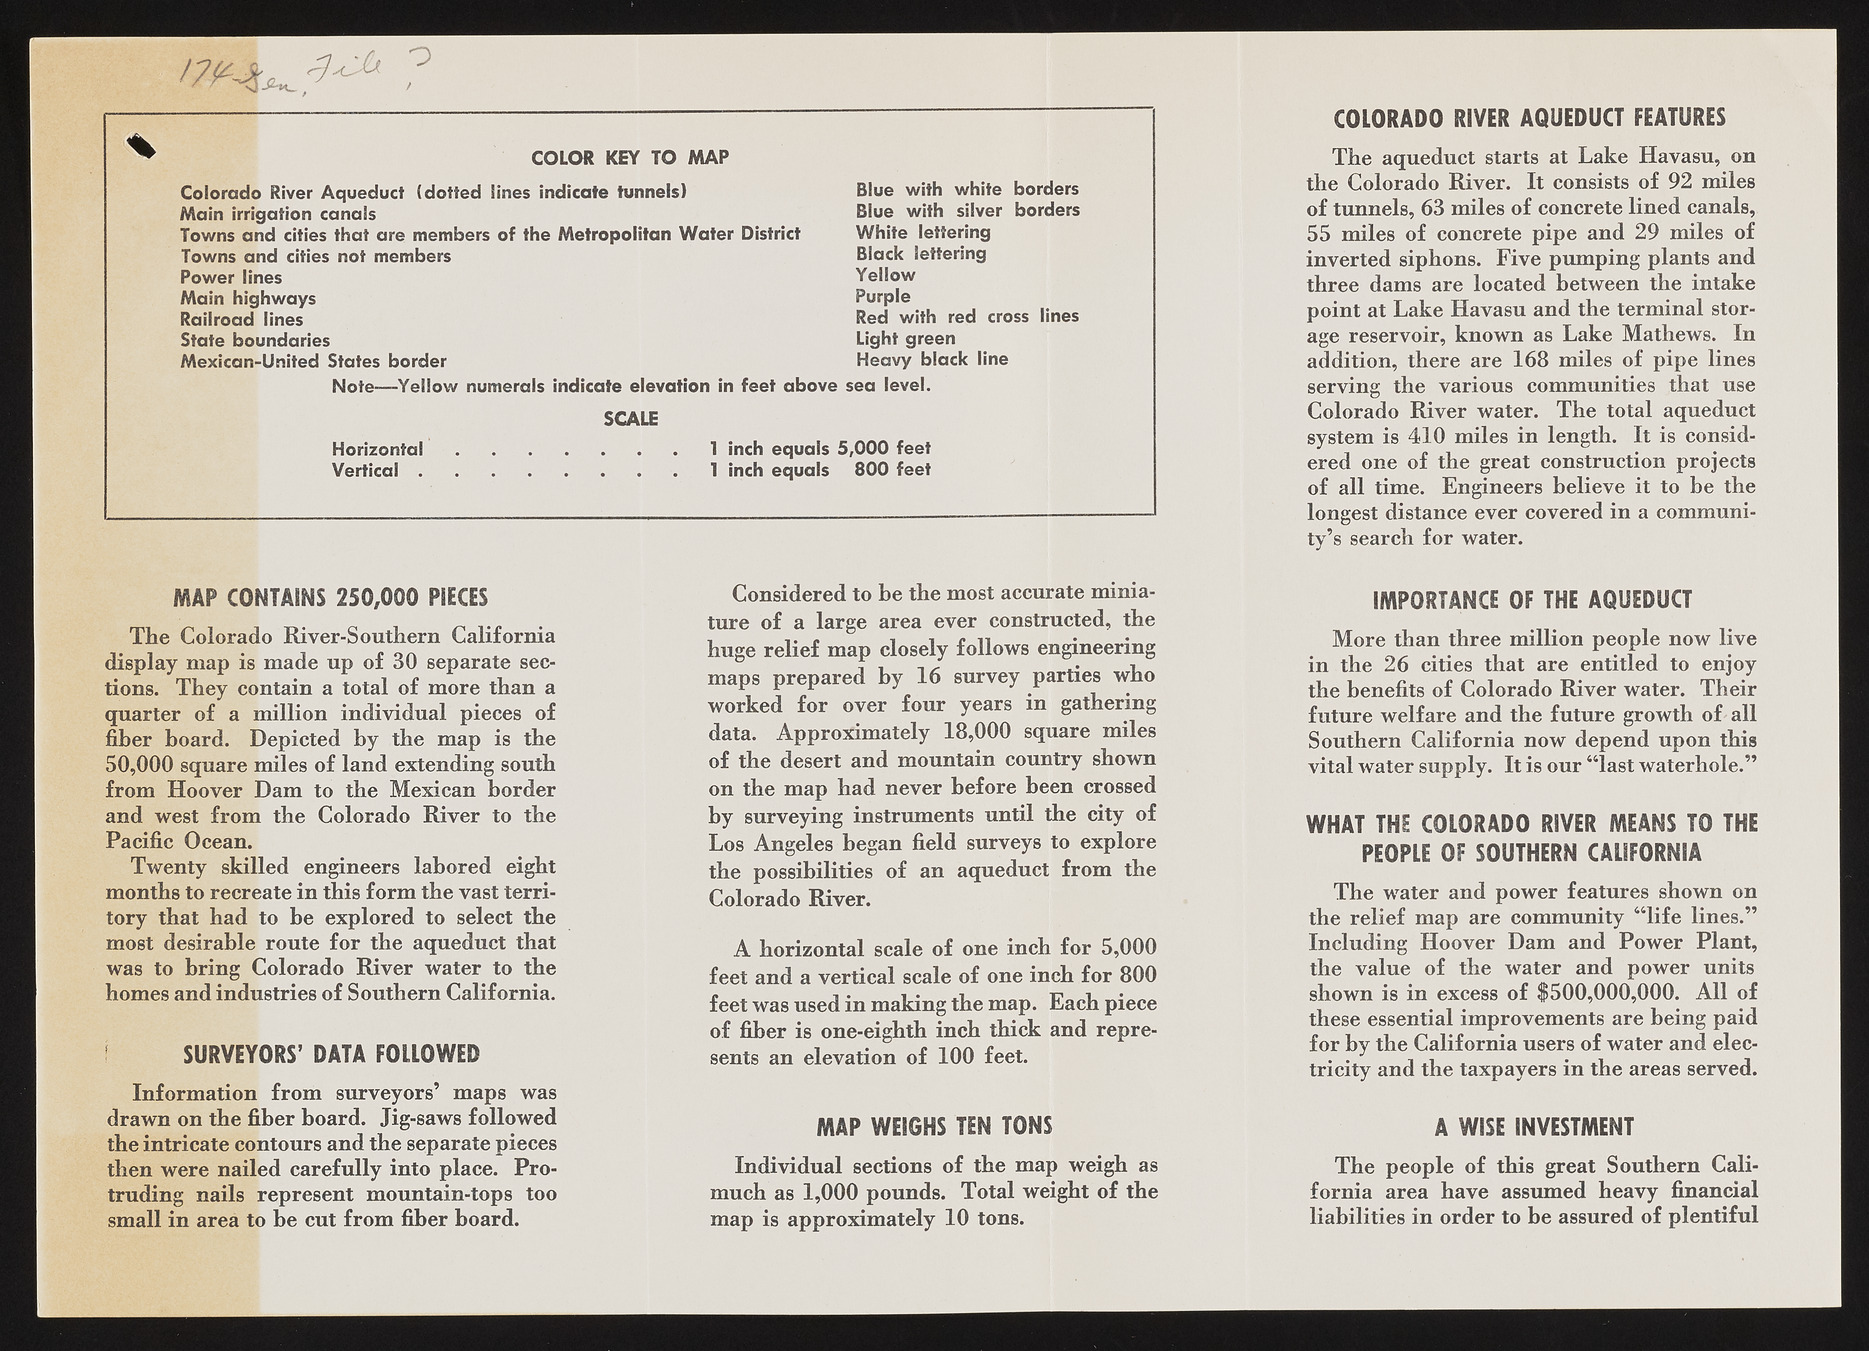
p m COLOR KEY TO MAP Colorado River Aqueduct (dotted lines indicate tunnels) Main irrigation canals Towns and cities that are members of the Metropolitan W ater District Towns and cities not members Power lines Main highways Railroad lines State boundaries Mexican-United States border Blue with white borders Blue with silver borders White lettering Black lettering Yellow Purple Red with red cross lines Light green Heavy black line Note— Yellow numerals indicate elevation in feet above sea level. SCALE H o r iz o n t a l................................................. 1 inch equals 5,000 feet V e r t ic a l......................................................... 1 inch equals 800 feet MAP CONTAINS 250,000 PIECES The Colorado River-Southern California display map is made up of 30 separate sections. They contain a total of more than a quarter of a million individual pieces of fiber board. Depicted by the map is the 50,000 square miles of land extending south from Hoover Dam to the Mexican border and west from the Colorado River to the Pacific Ocean. Twenty skilled engineers labored eight months to recreate in this form the vast terril tory that had to be explored to select the most desirable route for the aqueduct that was to bring Colorado River water to the homes and industries of Southern California. ! SURVEYORS’ DATA FOLLOWED Information from surveyors’ maps was drawn on the fiber hoard. Jig-saws followed the intricate contours and the separate pieces then were nailed carefully into place. Protruding nails represent mountain-tops too small in area to he cut from fiber board. Considered to be the most accurate miniature of a large area ever constructed, the huge relief map closely follows engineering maps prepared by 16 survey parties who worked for over four years in gathering data. Approximately 18,000 square miles of the desert and mountain country shown on the map had never before been crossed by surveying instruments until the city of Los Angeles began field surveys to explore the possibilities of an aqueduct from the Colorado River. A horizontal scale of one inch for 5,000 feet and a vertical scale of one inch for 800 feet was used in making the map. Each piece of fiber is one-eighth inch thick and represents an elevation of 100 feet. MAP WEIGHS TEN TONS Individual sections of the map weigh as much as 1,000 pounds. Total weight of the map is approximately 10 tons. COLORADO RIVER AQUEDUCT FEATURES The aqueduct starts at Lake Havasu, on the Colorado River. It consists of 92 miles of tunnels, 63 miles of concrete lined canals, 55 miles of concrete pipe and 29 miles of inverted siphons. Five pumping plants and three dams are located between the intake point at Lake Havasu and the terminal storage reservoir, known as Lake Mathews. In addition, there are 168 miles of pipe lines serving the various communities that use Colorado River water. The total aqueduct system is 410 miles in length. It is considered one of the great construction projects of all time. Engineers believe it to be the longest distance ever covered in a community’s search for water. IMPORTANCE OF THE AQUEDUCT More than three million people now live in the 26 cities that are entitled to enjoy the benefits of Colorado River water. Their future welfare and the future growth of all Southern California now depend upon this vital water supply. It is our “ last waterhole.” WHAT THE COLORADO RIVER MEANS TO THE PEOPLE OF SOUTHERN CALIFORNIA The water and power features shown on the relief map are community “ life lines.” Including Hoover Dam and Power Plant, the value of the water and power units shown is in excess of $500,000,000. All of these essential improvements are being paid for by the California users of water and electricity and the taxpayers in the areas served. A WISE INVESTMENT The people of this great Southern California area have assumed heavy financial liabilities in order to be assured of plentiful

