Copyright & Fair-use Agreement
UNLV Special Collections provides copies of materials to facilitate private study, scholarship, or research. Material not in the public domain may be used according to fair use of copyrighted materials as defined by copyright law. Please cite us.
Please note that UNLV may not own the copyright to these materials and cannot provide permission to publish or distribute materials when UNLV is not the copyright holder. The user is solely responsible for determining the copyright status of materials and obtaining permission to use material from the copyright holder and for determining whether any permissions relating to any other rights are necessary for the intended use, and for obtaining all required permissions beyond that allowed by fair use.
Read more about our reproduction and use policy.
I agree.Information
Digital ID
Permalink
Details
More Info
Rights
Digital Provenance
Publisher
Transcription
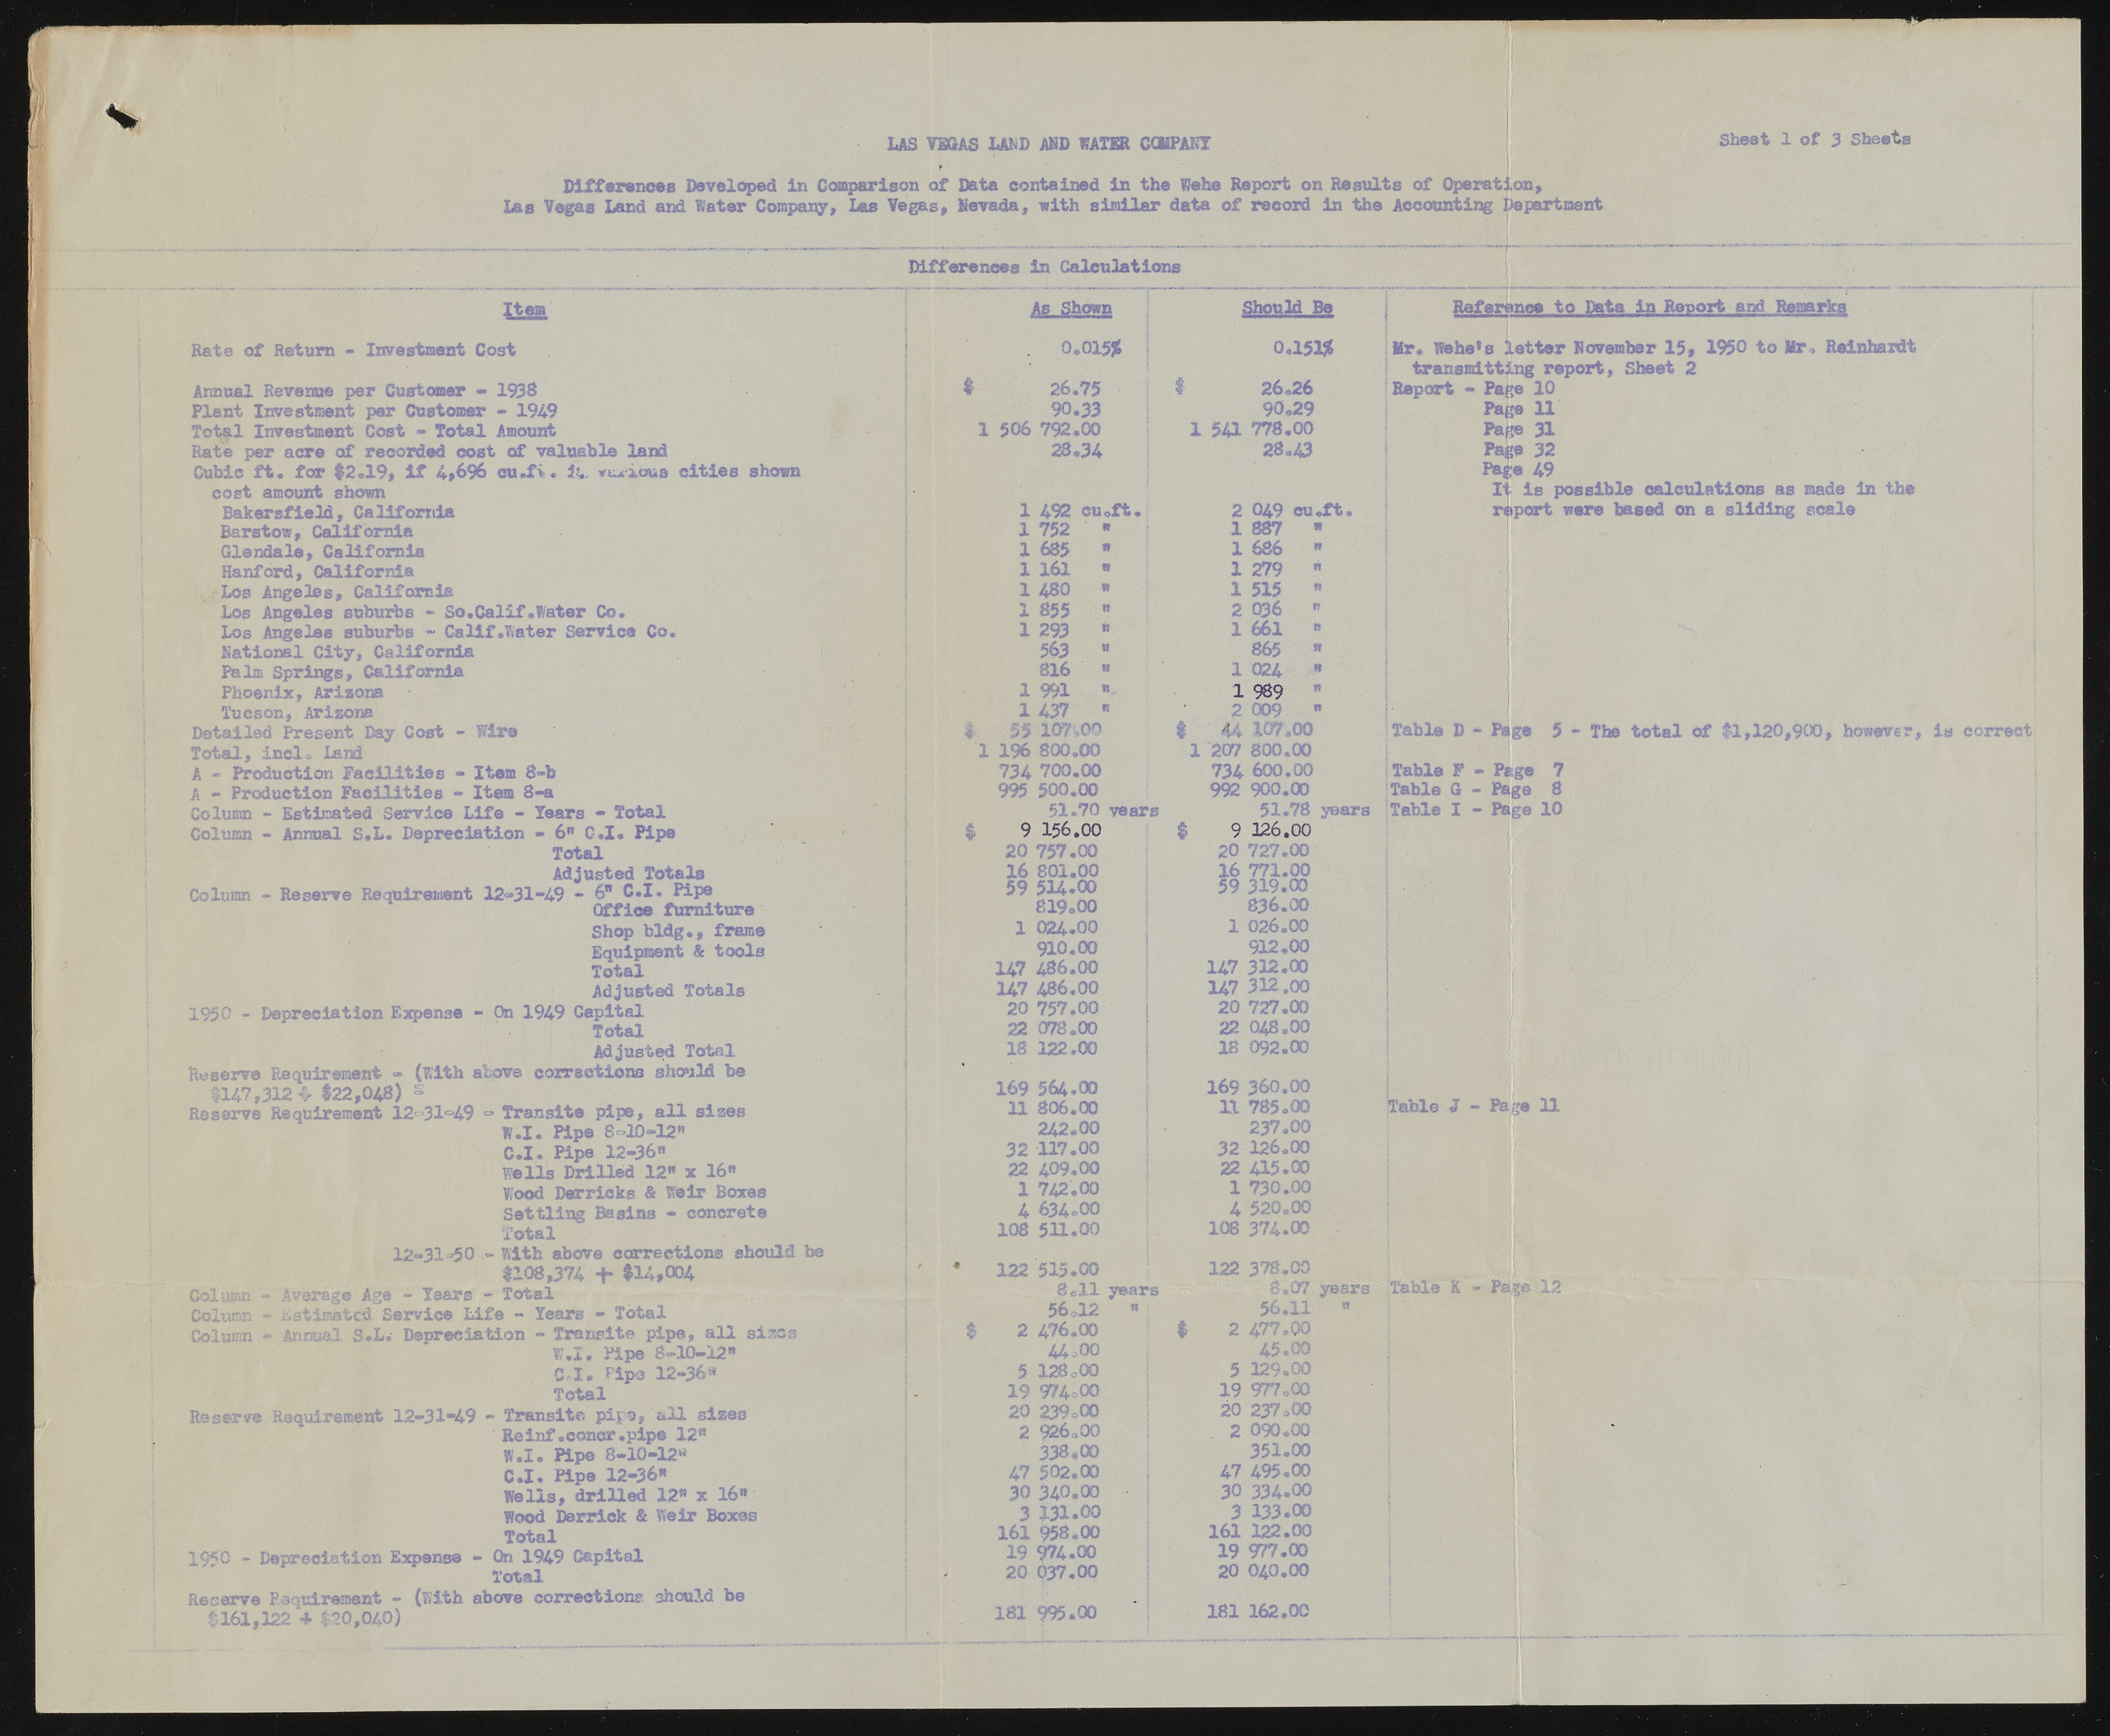
LAS VEGAS LAND AND WATER CCKPAKT Sheet 1 o f 3 Sheets f Differences Developed in Comparison of Data contained in the Wehe Report on Results of Operation, Las Vegas Land and Water Company, las Vegas, Nevada, with similar data of record in the Accounting Department L Item Rate of Return - Investment Cost Annual Revenue per Customer - 199$ Plant Investment per Customer - 1949 Tot^l Investment Cost - Total Amount Rate per acre of recorded cost of valuable land Cubic ft* for #2*19, if 4,696 cu»f>. It. vtu-ioua cities shown cost amount shown Bakersfield, California Barstow, California Glendale, California Hanford, California Los Angeles, California Los Angeles suburbs - So.Calif.Water Co. Los Angeles suburbs - Calif .Water Service Co. National City, California Palm Springs, California Phoenix, Arizona Tucson, Arizona Detailed Present Day Cost - Wire Total, inclo land A » Production Facilities - Item 8-b A - Production Facilities - Item 8-a Column - Estimated Service Life - Tears ** Total Column - Annual S.L. Depreciation - 6n C.I. Pipe Total ./IfpiH Adjusted Totals Column - Reserve Requirement 12-31-49 - 6" C.I. Pipe Office furniture Shop bldg., frame Equipment & tools Total Adjusted Totals 1950 - Depreciation Expense - On 1949 Capital Total Adjusted Total Reserve Requirement « (with above corrections should be $147,312 <r 122,04$) ¥ Reserve Requirement 12 ’31ca49 '=» Transits pipe, all sizes W.I. Pipe 8-10-12" C.I. Pipe 12-36" Wells Drilled 12" x 16" Wood Derricks & Weir Boxes Settling Basins - concrete Total With above corrections should 1 $108,374 + $14,004 Total Estimated Service Life - Tears - Total Annual S.L. Depreciation - Transit© pipe, all sizes W.I. Pipe 8-10-12" C.I. Pips 12-36s Total Transit© pips, all sizes Reinf.concr.pipe 12" W.I. Pipe 8-10-12** C.I. Pipe 12-36" Wells, drilled 12" x 16" Wood Derrick & Weir Boxes Total 19<C - Depreciation Expense - On 1949 Capital Total Reserve Requirement - (With above corrections should be *161,122 + $20,040) Differences in Calculations Aft. 0.015$ ! 26.75 90.33 1 506 792.00 28.34 1 Should Be 0.151$ 26.26 90.29 778.00 28.43 1 492 cueft. 2 049 cu«ft 1 752 ' * 1 887 IV 1 685 If 1 686 IV 1 161 If 1 279 It 1 480 « 1 515 91 1 855 ft 2 036 If 1 293 tl 1 661 19 563 If 865 ft 816 « 1 024 ft 1 991 1 989 ft 1 437 IS 2 009 t» ! Reference to Data in Ranort and Remarks Hr. We he *s letter November 15, 1950 to Mr* Reinhardt transmitting report, Sheet 2 Report - Page 10 Page 11 Page 31 PajjfC 32 Page 49 It is possible calculations as made in the report were based on a sliding scale 12-31-50 Column - Average Age - Tears Column Column Reserve Requirement 12-31*49 55 107,00 196 800.00 734 700.00 995 500.00 51.70 vaars 9 156.00 20 757.00 16 801.00 59 514.00 819.00 1 024.00 910.00 147 486.00 147 486.00 20 757.00 22 078.00 18 122.00 169 564.00 11 806.00 242.00 32 117.00 22 409.00 1 742.00 4 634.00 108 511.00 122 515.00 8.11 years 56.12 " 2 476.00 44,00 5 128o00 19 974o00 20 239o00 2 926o00 338#00 47 502.00 30 340.00 3 131.00 161 958,00 19 974.00 20 037.00 181 995.00 ‘ 44 107.00 207 800.00 734 600.00 992 900.00 51.78 years 9 126.00 20 727.00 16 771.00 59 319.00 8 3 6.00 1 026.00 912.00 147 312.00 147 312.00 20 727.00 22 048.00 18 092.00 169 3 6 0 .0 0 11 785.00 237.00 32 126.00 22 415*00 1 730.00 4 520.00 108 374.00 122 378.00 I 8.07 years 56.11 " 2 477.00 45.00 5 129.00 19 977.00 20 237.00 2 090.00 351.00 47 495.00 30 334.00 3 133.00 161 122.00 19 977.00 20 040.00 181 162.00 Table D - Page 5 - The total of $1,120,900, however, is correct {Table F - Page 7 Table G - Page 8 Table I - Page 10 Table J - Page 11 Table K - Page 12

