Copyright & Fair-use Agreement
UNLV Special Collections provides copies of materials to facilitate private study, scholarship, or research. Material not in the public domain may be used according to fair use of copyrighted materials as defined by copyright law. Please cite us.
Please note that UNLV may not own the copyright to these materials and cannot provide permission to publish or distribute materials when UNLV is not the copyright holder. The user is solely responsible for determining the copyright status of materials and obtaining permission to use material from the copyright holder and for determining whether any permissions relating to any other rights are necessary for the intended use, and for obtaining all required permissions beyond that allowed by fair use.
Read more about our reproduction and use policy.
I agree.Information
Digital ID
Permalink
Details
More Info
Rights
Digital Provenance
Publisher
Transcription
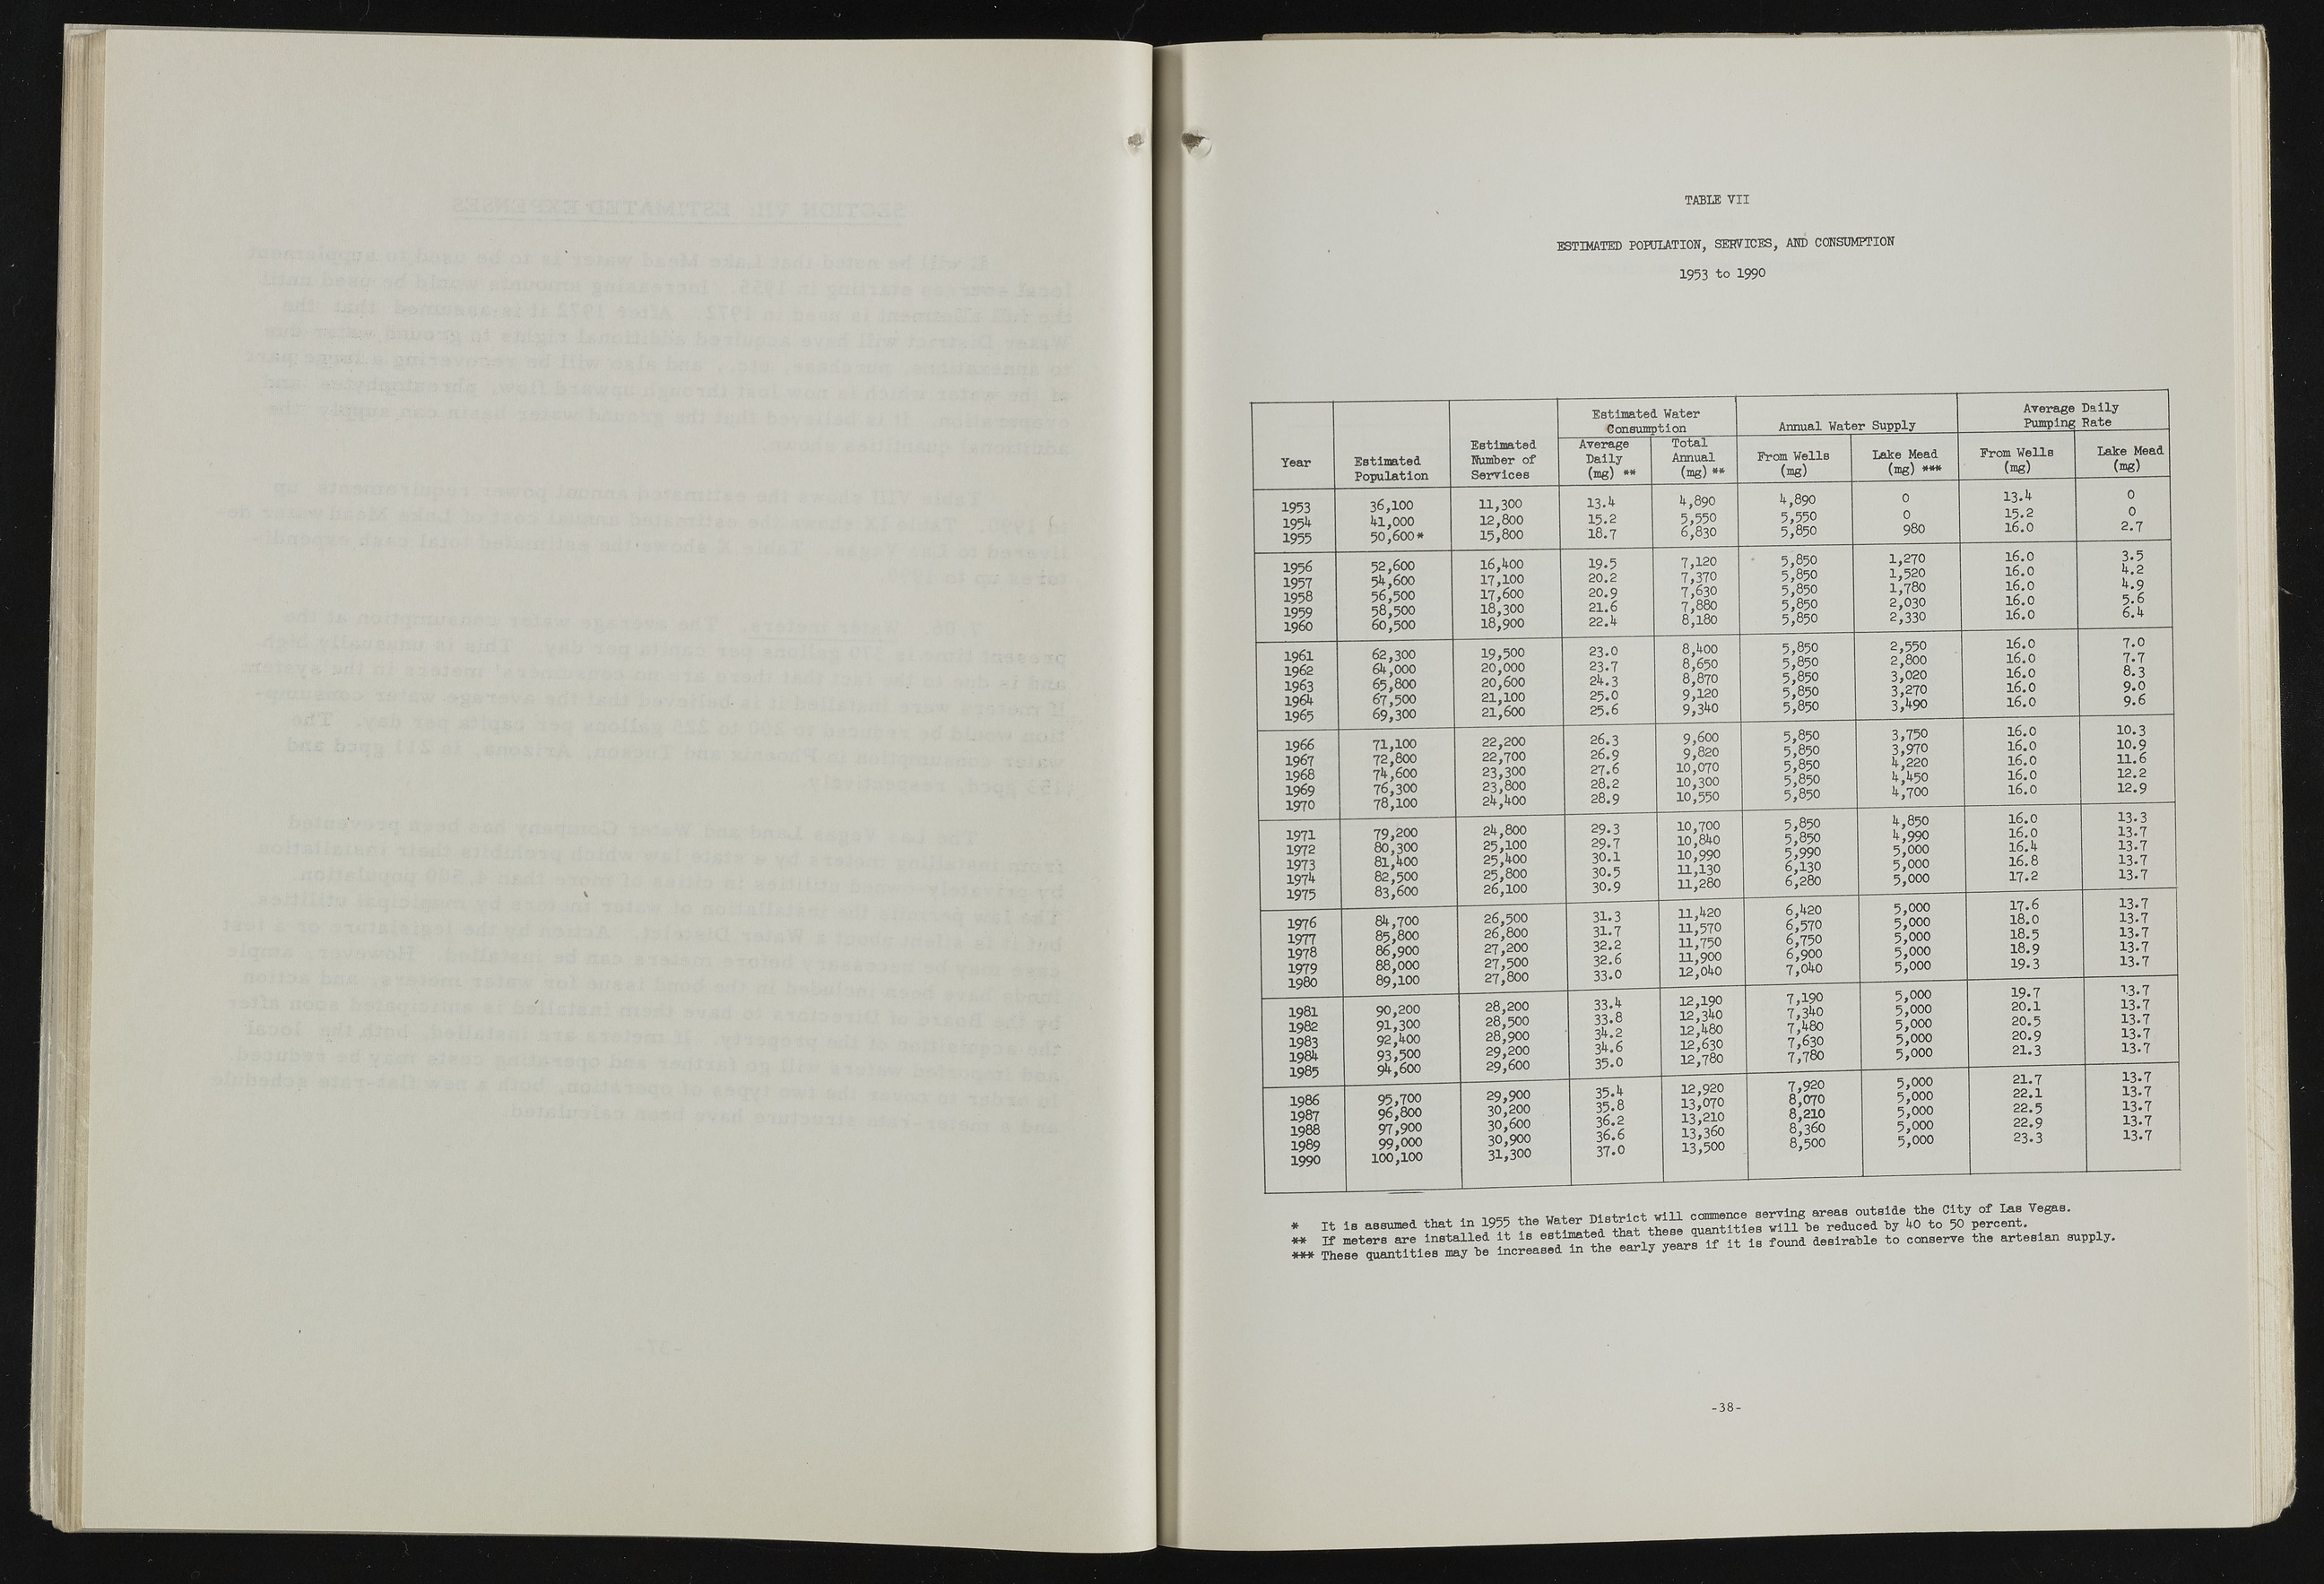
' 51 RfSIli! i TABLE VII IT , ESTIMATED POPULATION, SERVICES, AND CONSUMPTION 1953 to 199° Year Estimated Population Estimated Water Consumption Annual Water Supply Average Pumping Daily Pate Estimated Number of Services Average Daily (mg) ** Total Annual (mg) ** From Wells (mg) Lake Mead (mg) «*» From Wells (mg) Lake Mead (mg) 1953 195^ 1955 3 6 ,10 0 ltl,00 0 50 ,6 0 0 * 11 ,3 0 0 12 ,8 0 0 15 ,8 0 0 13.ft 1 5 . 2 18.7 ft,89O 5,550 6,830 ft,890 5,550 5,850 0 - 0 : t 98O 13.lt 15.2 16 .0 0 0 2.7 1956 1957 1958 1959 1960 52,600 5 lt,600 56.500 58.500 60.500 i6,ftoo 1 7 ,1 0 0 17 ,6 0 0 18 ,3 0 0 18 ,9 0 0 19.5 2 0 .2 20.9 2 1 .6 22.lt 7 ,12 0 7,370 7,630 7,880 8 ,18 0 5.850 5.850 5.850 5.850 5.850 1 ,2 7 0 1 ,5 2 0 1,7 8 0 2 ,0 30 2 ,3 3 0 16 .0 1 6 .0 1 6 .0 1 6 .0 16 .0 3.5 it. 2 ft.9 5.6 6 .>t 19 6 1 1962 1963 196lt 1965 62,300 61t ,000 65,800 67,500 69,300 19,500 20,000 20,600 2 1 ,1 0 0 2 1,6 0 0 2 3 .0 23.7 2lt.3 2 5 .0 2 5 .6 8,ftoo 8,650 8,870 9 ,12 0 9, 3*t0 5.850 5.850 5.850 5.850 5.850 2 ,5 5 0 . 2,800 3,020 3,270 3,*t90 16 .0 16 .0 16 .0 16 .0 1 6 .0 7.0 7.7 8.3 9.0 9.6 1966 1967 1968 1969 1970 7 1,1 0 0 72,800 7ft ,600 76,300 7 8 ,10 0 22,200 22,700 23,300 23,800 2lt,lt00 26.3 26.9 2 7.6 2 8 .2 28 .9 9,600 9,820 10 ,0 70 10 ,3 0 0 10,550 5.850 5.850 5.850 5.850 5.8 50 3,750 3,970 ft,220 ft,lt50 ft,700 16 .0 1 6 .0 1 6 .0 1 6 .0 1 6 .0 1 0 .3 10.9 1 1 . 6 1 2 . 2 12.9 1971 1972 1973 197^ 1975 79,200 80,300 8l,ft00 82,500 83,600 2lt,800 2 5 ,10 0 25,lt00 25,800 2 6 ,10 0 29.3 29.7 30.1 30.5 30.9 10 ,7 0 0 10,8lt0 10,990 11,130 11 ,2 8 0 5.850 5.850 5,990 6,130 6,280 ft,850 ft,990 5,000 5.000 5.000 16 .0 16 .0 l6 .lt 1 6 .8 17.2 13.3 1 3 . 7 13.7 13.7 13.7 1976 1977 1978 1979 1980 81t ,700 85,800 86,900 88,000 8 9 ,10 0 26,500 26,800 27,200 27,500 27,800 31.3 31.7 3 2 .2 32 .6 33.0 ll,lt2 0 11,570 11,750 11,900 12,0lt0 6,lt20 6,570 6,750 6,900 7,0lt0 5.000 5.000 5.000 5.000 5.000 17.6 18 .0 18.5 18.9 19.3 13.7 13-7 13.7 13.7 13.7 19 8 1 1982 1983 1981t 1985 90,200 91,300 92,lt00 9 3,500 9ft,600 28,200 28,500 28,900 29,200 29,600 33.lt 33.8 3lt.2 3ft. 6 35.0 12,190 12, 3*t0 12,>t80 12 ,6 3 0 12,780 7 ,19 0 7»3*tO 7,lt80 7,630 7,78 0 5.000 5.000 5.000 5.000 5.000 19.7 2 0 . 1 20.5 20.9 21.3 13.7 13.7 13.7 13. 7 , 13. 7 ’ 1986 1987 1988 1989 1990 95,700 96,800 97,900 99,000 10 0 ,10 0 29.900 30,200 30,600 30.900 31,300 35.*f 35.8 36 .2 36 .6 37.0 12,920 13,070 1 3 , 2 1 0 13,360 13,500 7,920 8,070 8 ,2 10 8,360 8,500 5.000 5.000 5.000 5.000 5.000 2 1 . 7 2 2 . 1 22.5 22.9 23.3 13.7 13.7 13.7 13.7 13.7 * «* is assumed that in 1955 the Wat^ Distriot vlll E | 8 S | | H ^ ^ L ^ d l f t L early years if it is found desirable to conserve the artesian supply. - 38-

