Copyright & Fair-use Agreement
UNLV Special Collections provides copies of materials to facilitate private study, scholarship, or research. Material not in the public domain may be used according to fair use of copyrighted materials as defined by copyright law. Please cite us.
Please note that UNLV may not own the copyright to these materials and cannot provide permission to publish or distribute materials when UNLV is not the copyright holder. The user is solely responsible for determining the copyright status of materials and obtaining permission to use material from the copyright holder and for determining whether any permissions relating to any other rights are necessary for the intended use, and for obtaining all required permissions beyond that allowed by fair use.
Read more about our reproduction and use policy.
I agree.Information
Digital ID
Permalink
Details
More Info
Rights
Digital Provenance
Publisher
Transcription
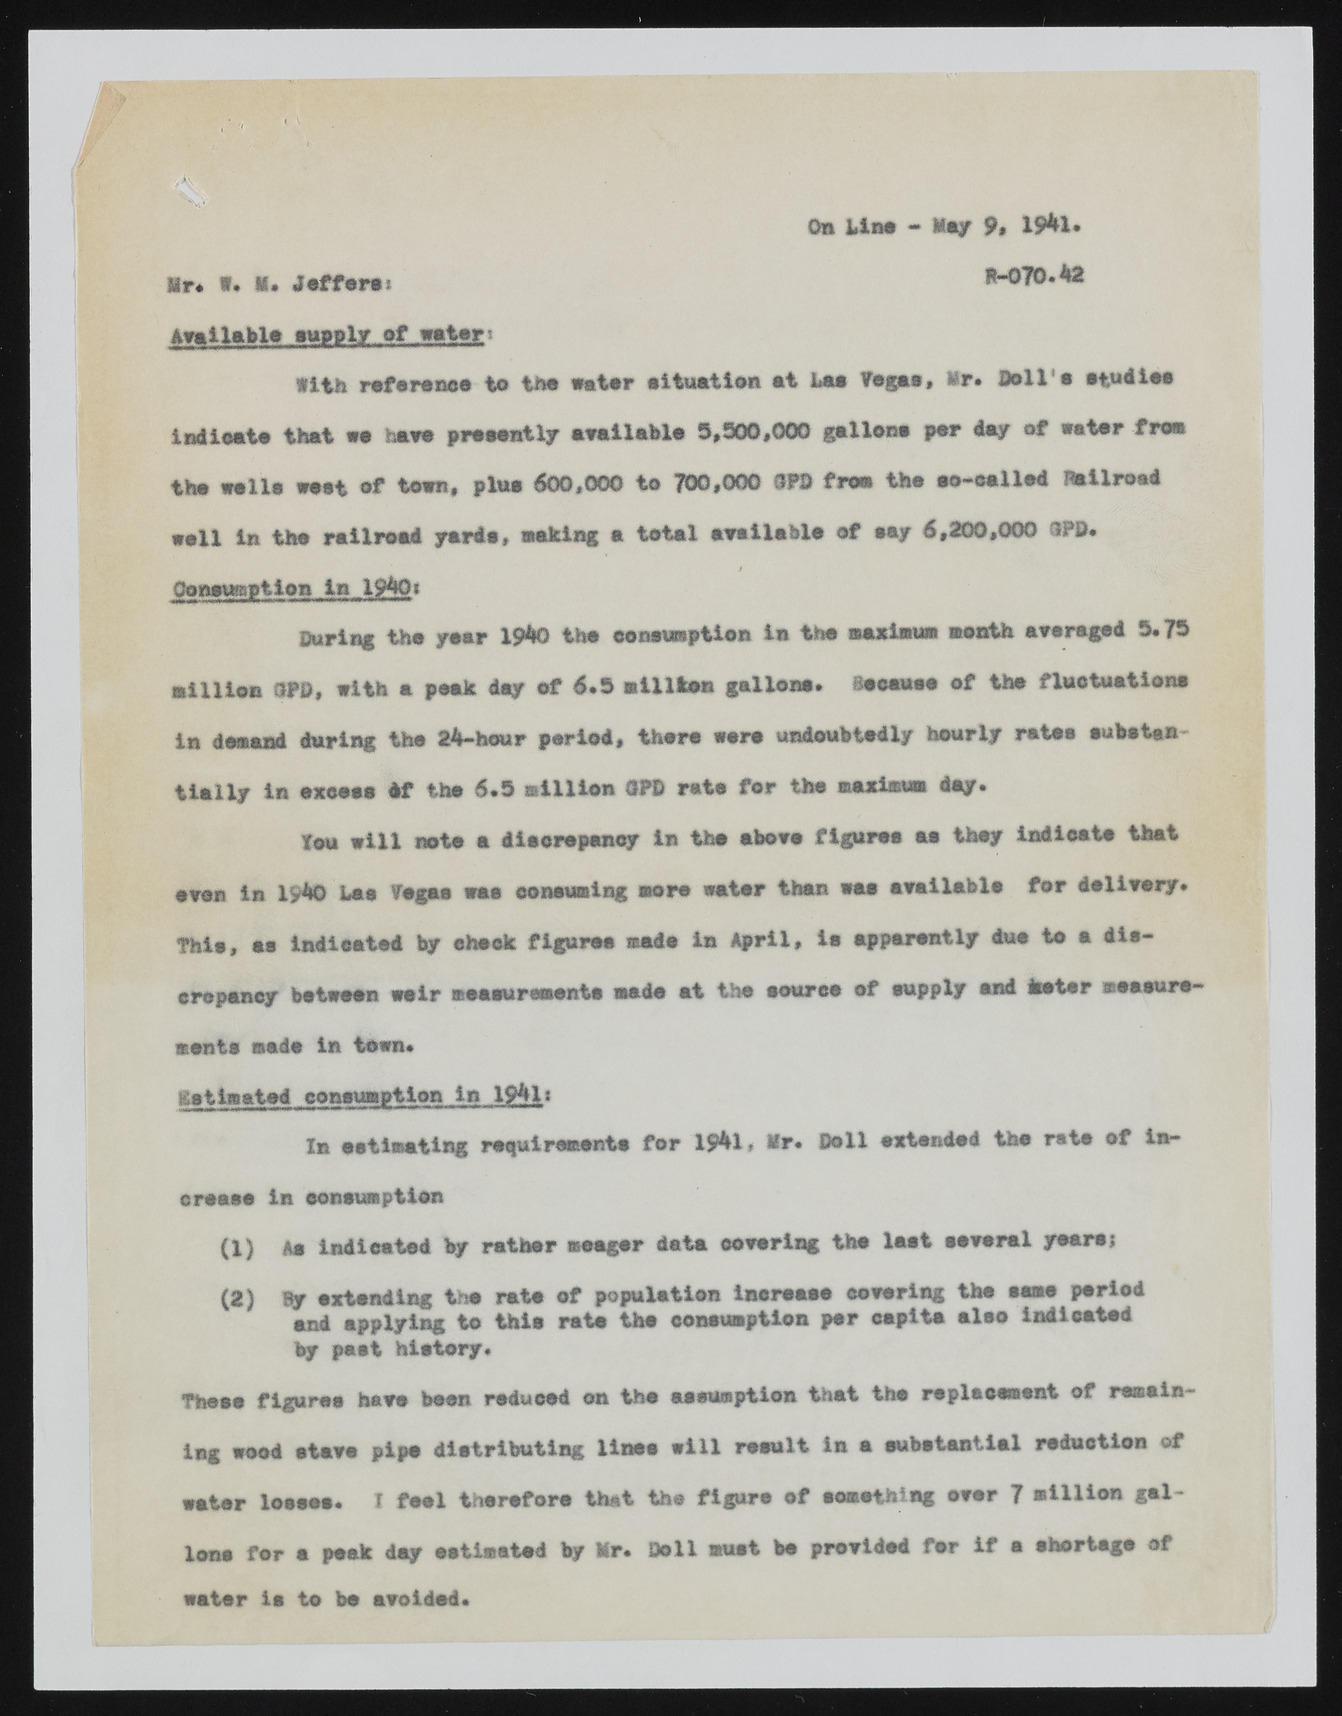
Ob Swiss - May 9* 194l. Mr* V. ||. Joffersi #-070.42 Available supply of water-llih raftranet to tha aatar situation at Laa Tegaa, Mr. Sail'a atadlM indicate that ta have presently available 3.500,000 gallon* per day of eater fro* the trails west of town, plus 600,000 to 700,000 9PD from the *0-0*11*4 Railroad well in the railroad yard*, making a total available of *ay 6,200,000 OPS* Consumption in 1940; During the year 1940 the consumption in the maximum month averaged 3.73 million OPD, with a peak day of 6.3 million gallon*. 8acausa of the fluctuation* in demand during the 24-hour period, there were undoubtedly hourly rate* substantially in exeese 6f the 6.3 million OPD rate for the maximum day. You will note a discrepancy in the above figures as they indicate that even in 1940 Lee Vegas arse consuming mere water than was available for delivery* This, ee Indicated by ehsok figure# made in April, is apparently due to a discrepancy between weir moaouramont* made at the source of supply and hater measure* ments made In town. aetimated consumption in 19411 In estimating requirements for 1941, Mr. Dell extended the rate of increase in consumption (1) Aa indicated by rather meager data covering the lest several years; (2) By extending tee rate ef population increase covering the came period end applying to this rate the consumption per capita also indicated by past history. These figures have been reduced on the aasumption that the replacement of remain-ing wood stave pipe distributing lines will result in * substantial reduction of water lessee. I feel therefore that the figure ef something ever 7 million gallons for e peek day estimated by Mr. Doll must be provided for if a shortage of water ia to be avoided.

