Copyright & Fair-use Agreement
UNLV Special Collections provides copies of materials to facilitate private study, scholarship, or research. Material not in the public domain may be used according to fair use of copyrighted materials as defined by copyright law. Please cite us.
Please note that UNLV may not own the copyright to these materials and cannot provide permission to publish or distribute materials when UNLV is not the copyright holder. The user is solely responsible for determining the copyright status of materials and obtaining permission to use material from the copyright holder and for determining whether any permissions relating to any other rights are necessary for the intended use, and for obtaining all required permissions beyond that allowed by fair use.
Read more about our reproduction and use policy.
I agree.Information
Digital ID
Permalink
More Info
Rights
Digital Provenance
Publisher
Transcription
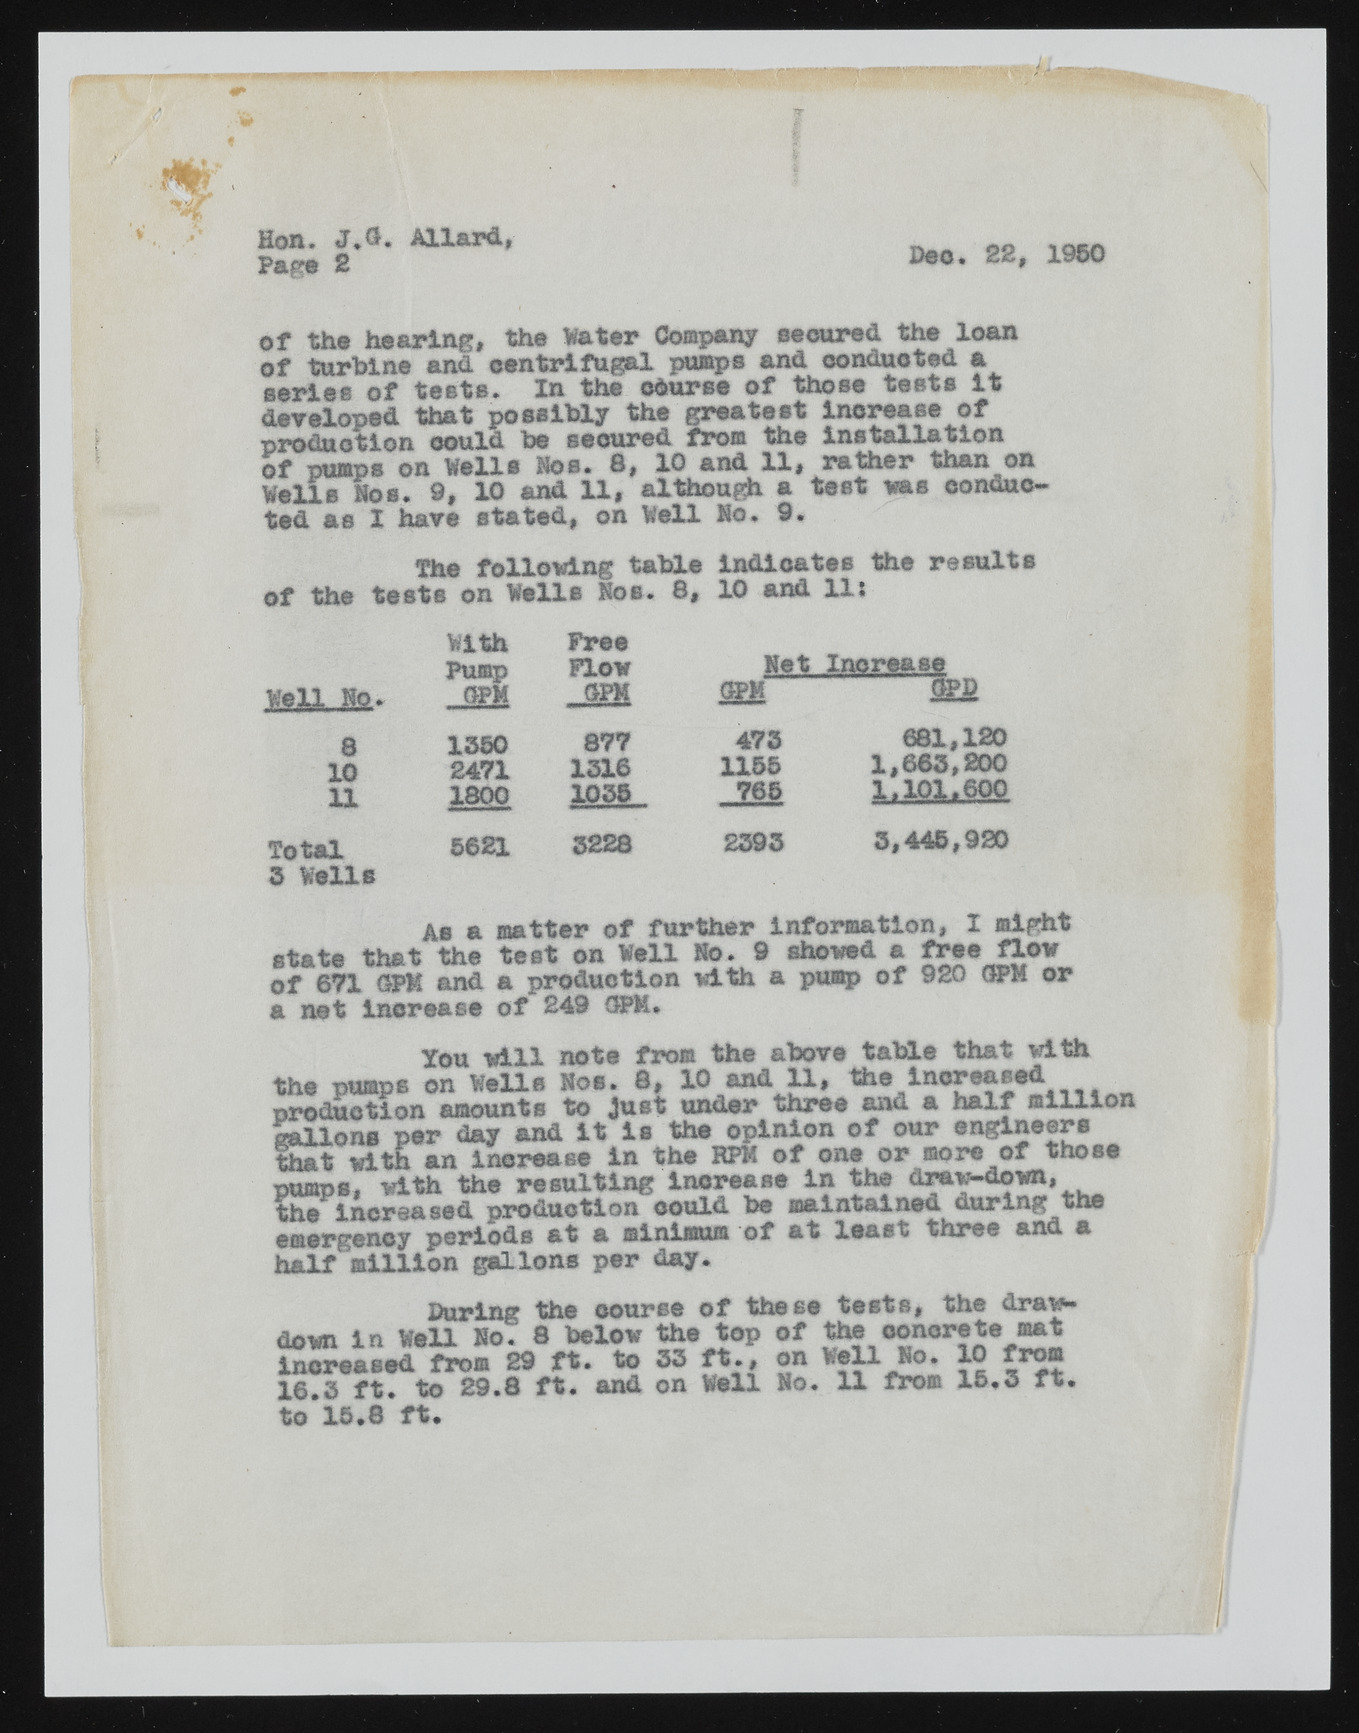
Hon. J.G. Allard, Page 2 Deo. 22, 1950 of the hearing, the Water Company secured the loan of turbine and centrifugal pumps and conducted a aeries of teste. In the odurse of those tests it developed that possibly the greatest increase of production could be seoured fro® the installation of pumps on Wells Nos. 8, 10 and 11, rather than on Walls Nos. 9, 10 and 11, although a test m s conducted as 1 have stated, on Well No* 9. The following table indicates the results of the tests on Walls Nos. 8, 10 and 11: With Free Pump Flew Net Increase Well No. am PPM GPM QPD 8 1350 877 473 681,120 10 2471 1316 1155 1,663,200 11 1800 1035 765 1.101.600 Total 5621 5228 2395 3,445,920 3 Wells As a matter of further information, I might state that the test on Well No. 9 showed a £**ee flow of 671 OPM and a production with a pump of 920 0PM or a net increase of 249 GPU. Xou will note from the above table that with the pumps on Wells Nos. 8, 10 and U , production amounts to just under three taened I an chraelafse mdi llion gallons per day and it is the opinion of our engineers teat with an increase in the RFK of one or more of those ptuhmep si,n cwrietahs etde ep rroedsuuclttioinn gc ionuclrde abes e maiinn tthaei ned during thea emergency periods at a minimum of at least three and a half million gallons per day. During the course of these tests, the drawdown in Well No. 8 below the top of the concrete mat increased from 29 ft. to 33 ft., on Well No. 10 from 16.3 ft. to 29.8 ft. and on Well No. 11 from 15,3 ft. to 15.8 ft.

