Copyright & Fair-use Agreement
UNLV Special Collections provides copies of materials to facilitate private study, scholarship, or research. Material not in the public domain may be used according to fair use of copyrighted materials as defined by copyright law. Please cite us.
Please note that UNLV may not own the copyright to these materials and cannot provide permission to publish or distribute materials when UNLV is not the copyright holder. The user is solely responsible for determining the copyright status of materials and obtaining permission to use material from the copyright holder and for determining whether any permissions relating to any other rights are necessary for the intended use, and for obtaining all required permissions beyond that allowed by fair use.
Read more about our reproduction and use policy.
I agree.Information
Digital ID
Permalink
Details
More Info
Rights
Digital Provenance
Publisher
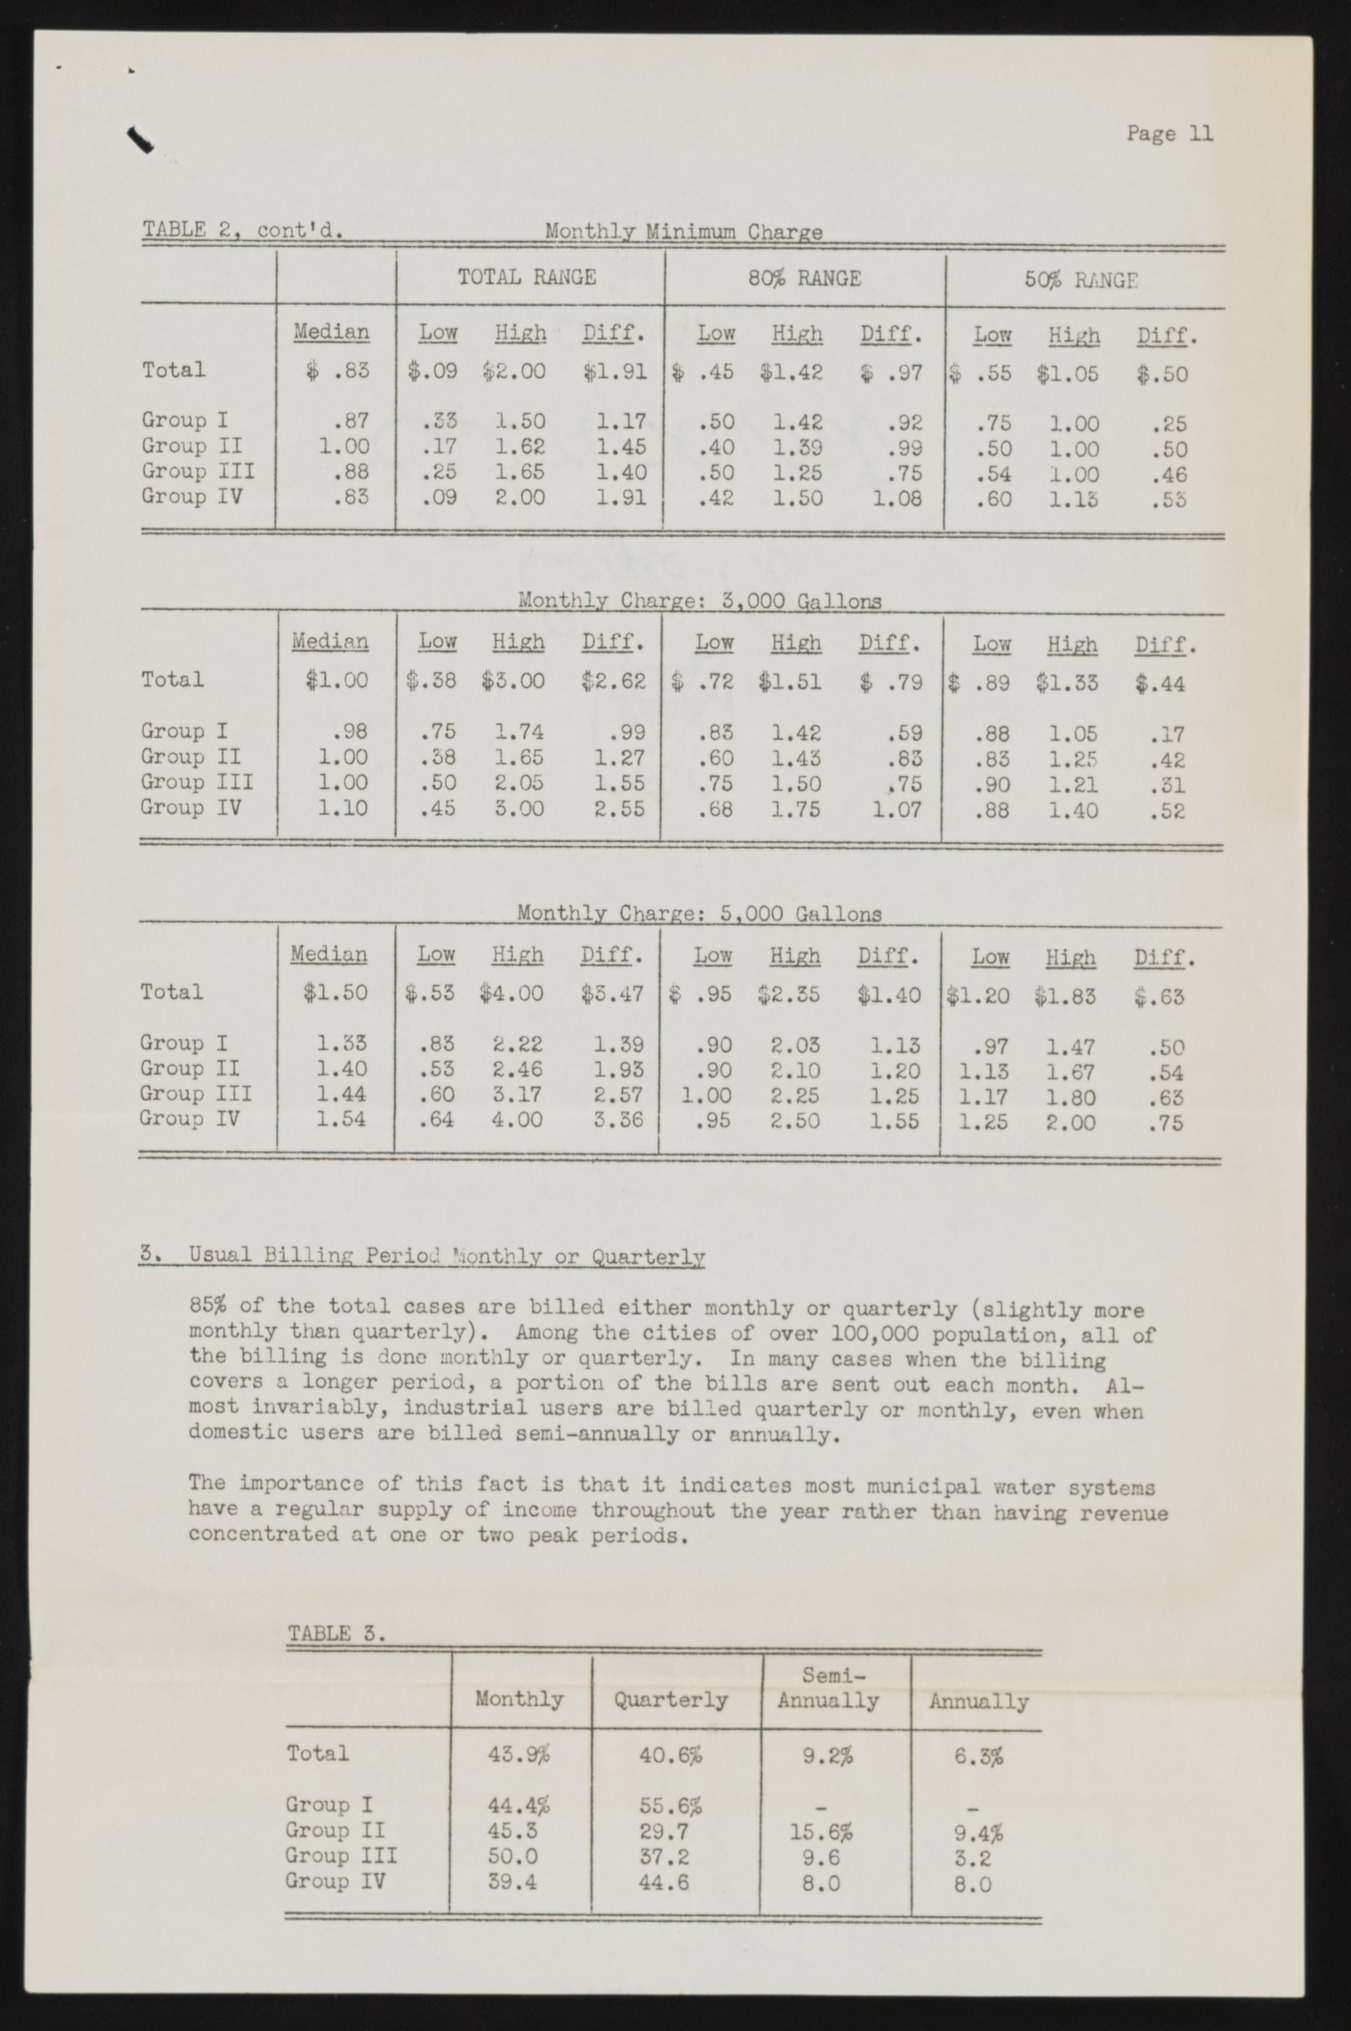
Transcription
Page 11 'iiu t unxjf in. TOTAL RANGE viicu. 80% RANGE 50% RANGE Median Low High Diff. Low High Diff. Low S i g h Diff. Total $ .83 $.09 $2.00 $1.91 $ .45 $1.42 $ .97 $ .55 $1.05 $.50 Group I .87 .55 1.50 1.17 .50 1.42 .92 .75 Group II 1.00 .25 1.00 .17 1.62 1.45 .40 1.39 .99 .50 1.00 .50 Group III .88 .25 1.65 1.40 .50 1.25 .75 .54 1.00 .46 Group IV .83 .09 2.00 1.91 .42 1.50 1.08 .60 1.15 .55 Monthly Charge: 5.000 Gallons Median Low High Diff. Low High Diff. Low High Diff. Total $1.00 $.38 $3.00 $2.62 $ .72 $1.51 $ .79 $ .89 $1.33 $.44 Group I .98 .75 1.74 .99 .85 1.42 .59 .88 1.05 .17 Group II 1.00 .38 1.65 1.27 .60 1.43 • S3 .83 1.25 .42 Group III 1.00 .50 2.05 1.55 .75 1.50 .75 .90 1.21 .31 Group IV 1.10 .45 3.00 2.55 .68 1.75 1.07 .88 1.40 .52 Monthly Charge: 5,000 Gallons Median Low High Diff. Low High Diff. Low High Diff. Total $1.50 $.53 $4.00 $5.47 $ .95 $2.35 $1.40 $1.20 $1.83 $.63 Group I 1.55 .85 2.22 1.39 .90 2.03 1.13 .97 1.47 .50 Group II 1.40 .53 2.46 1.95 .90 2.10 1.20 1.13 1.67 .54 Group III 1.44 .60 3.17 2.57 1.00 2.25 1.25 1.17 1.80 .63 Group IV 1.54 .64 4.00 3.56 .95 2.50 1.55 1.25 2.00 .75 5. Usual Billing Period Monthly or Quarterly 85% of the total cases are billed either monthly or quarterly (slightly more monthly than quarterly). Among the cities of over 100,000 population, all of the billing is done monthly or quarterly. In many cases when the billing covers a longer period, a portion of the bills are sent out each month. Almost invariably, industrial users are billed quarterly or monthly, even when domestic users are billed semi-annually or annually. The importance of this fact is that it indicates most municipal water systems have a regular supply of income throughout the year rather than having revenue concentrated at one or two peak periods. TABLE 3. Monthly Quarterly Semi- Annually Annually Total 43.9% 40.6% 9.2% 6.5% Group I 44.4% 55.6% «B» Group II 45.3 29.7 15.6% 9.4% Group III 50.0 57.2 9.6 3.2 Group IV 59.4 44.6 8.0 8.0

