Copyright & Fair-use Agreement
UNLV Special Collections provides copies of materials to facilitate private study, scholarship, or research. Material not in the public domain may be used according to fair use of copyrighted materials as defined by copyright law. Please cite us.
Please note that UNLV may not own the copyright to these materials and cannot provide permission to publish or distribute materials when UNLV is not the copyright holder. The user is solely responsible for determining the copyright status of materials and obtaining permission to use material from the copyright holder and for determining whether any permissions relating to any other rights are necessary for the intended use, and for obtaining all required permissions beyond that allowed by fair use.
Read more about our reproduction and use policy.
I agree.Information
Digital ID
Permalink
Details
More Info
Rights
Digital Provenance
Publisher
Transcription
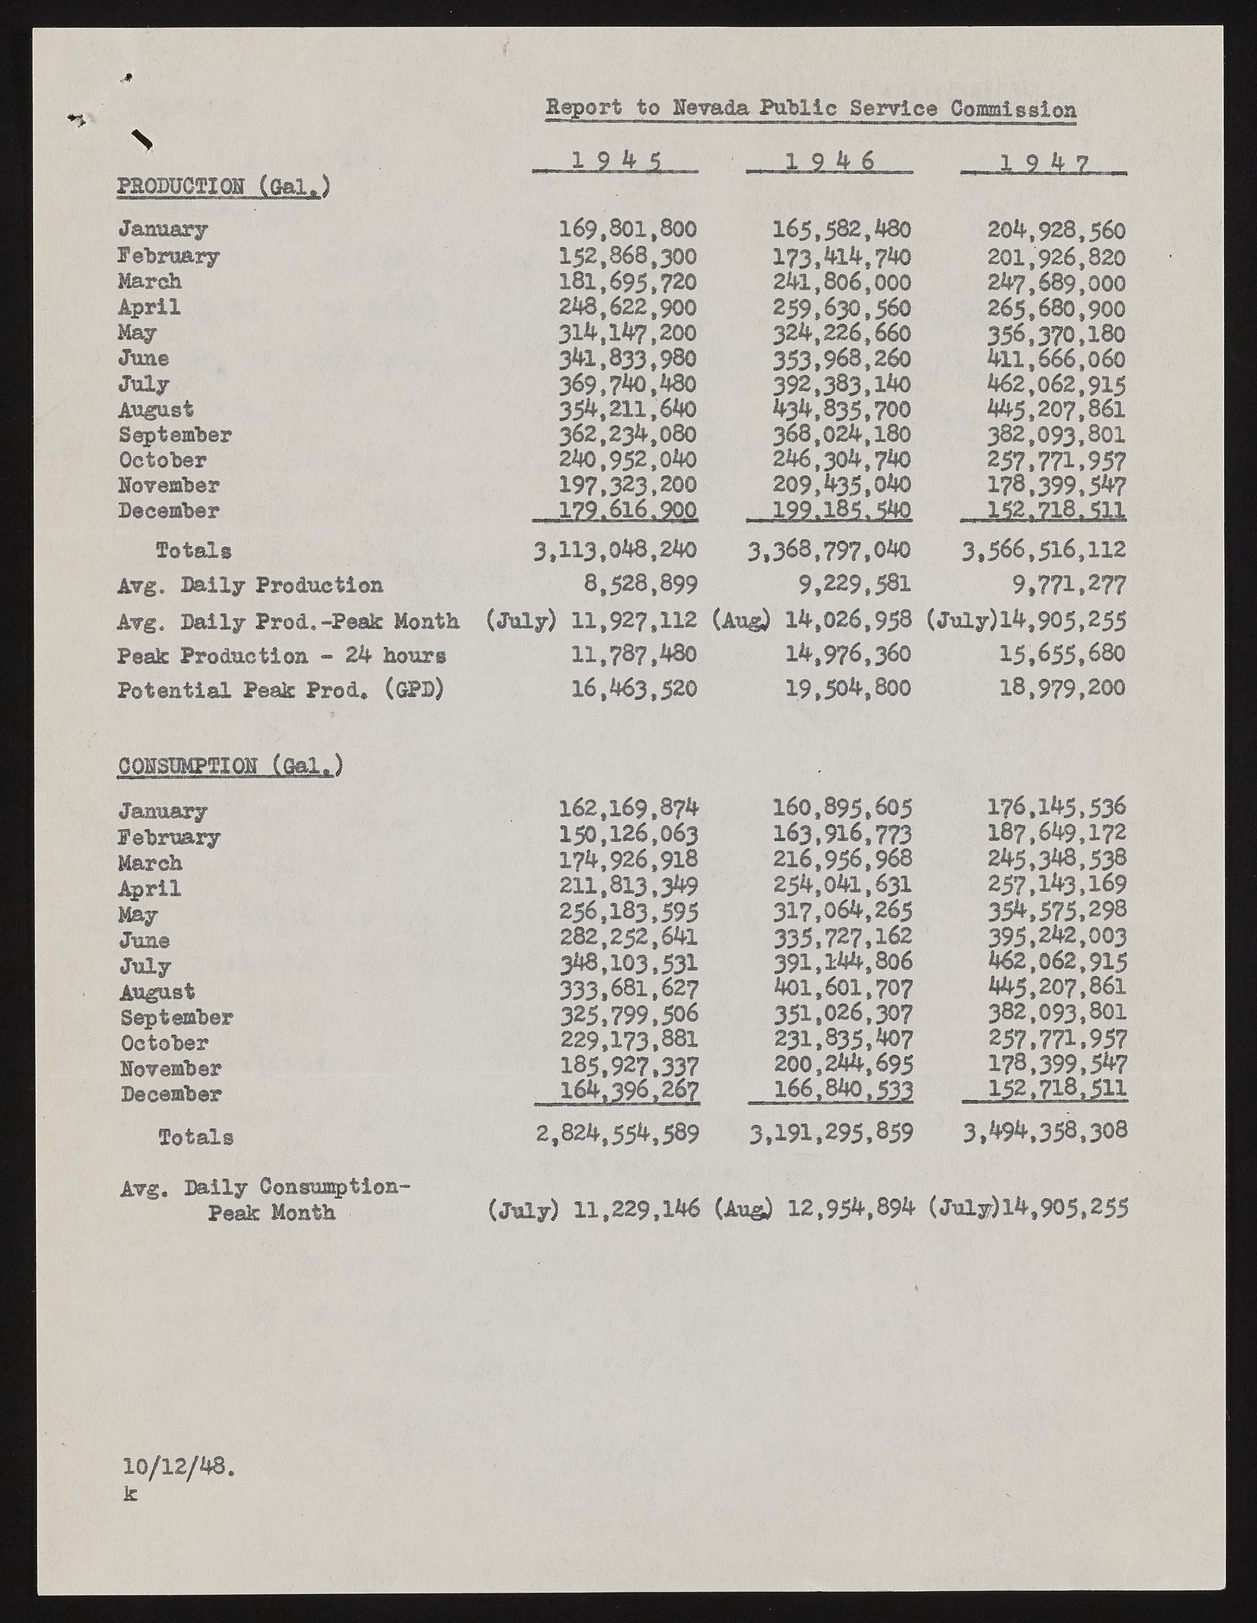
Report to Nevada Public Service Commission \ 19 4 5 19 4 6 19 4 7 PRODUCTION (Gal.) January 169,801,800 165,582,480 204,928,560 February 152,868,300 173,414,740 201,926,820 March 181,695,720 241,806,000 247,689,000 April 248,622,900 259,630,560 265,680,900 May 314,147,200 324,226,660 356,370,180 June 341,833,980 353,968,260 411,666,060 July 369,740,480 392,383,140 462,062,915 August 354,211,640 434,835,700 445,207,861 September 362,234,080 368,024,180 382,093,801 October 240,952,040 246,304,740 257,771,957 November 197,323,200 209,435,040 178,399,547 December 179.616.900 199.185,540 152.718.511 Totals 3,113,048,240 3,368,797,040 3,566,516,112 Avg. Daily Production 8,528,899 9,229,581 9,771.277 Avg. Daily Prod.-Peak Month (July) 11,927.112 (Aug) 14,026,958 (July)14,905,255 Peak Production - 24 hours 11,787,480 14,976,360 15,655,680 Potential Peak Prod. (GPD) 16,463,520 19,504,800 18,979,200 CONSUMPTION (Gal.) January 162,169,874 160,895,605 176.145,536 February 150,126,063 163,916,773 187,649,172 March 174,926,918 216,956,968 245,348,538 April 211,813,349 254,041,631 257,143,169 May 256,183,595 317,064,265 354,575,298 June 282,252,641 335,727,162 395,242,003 July 348,103,531 391,144,806 462,062,915 August 333,681,627 401,601,707 445,207,861 September 325,799,506 351,026,307 382,093,801 October 229,173,881 231,835,407 257,771,957 November 185,927,337 200,244,695 178,399,547 December 164.396,267 166.840.533 152,718,511 Totals 2,824,554,589 3,191,295,859 3,494,358,308 Avg. Daily Consumption- Peak Month (July) 11,229,1*** (Aug) 12,954,894 (July)14,905,255 10/12/48. k

