Copyright & Fair-use Agreement
UNLV Special Collections provides copies of materials to facilitate private study, scholarship, or research. Material not in the public domain may be used according to fair use of copyrighted materials as defined by copyright law. Please cite us.
Please note that UNLV may not own the copyright to these materials and cannot provide permission to publish or distribute materials when UNLV is not the copyright holder. The user is solely responsible for determining the copyright status of materials and obtaining permission to use material from the copyright holder and for determining whether any permissions relating to any other rights are necessary for the intended use, and for obtaining all required permissions beyond that allowed by fair use.
Read more about our reproduction and use policy.
I agree.Information
Digital ID
Permalink
Details
More Info
Rights
Digital Provenance
Publisher
Transcription
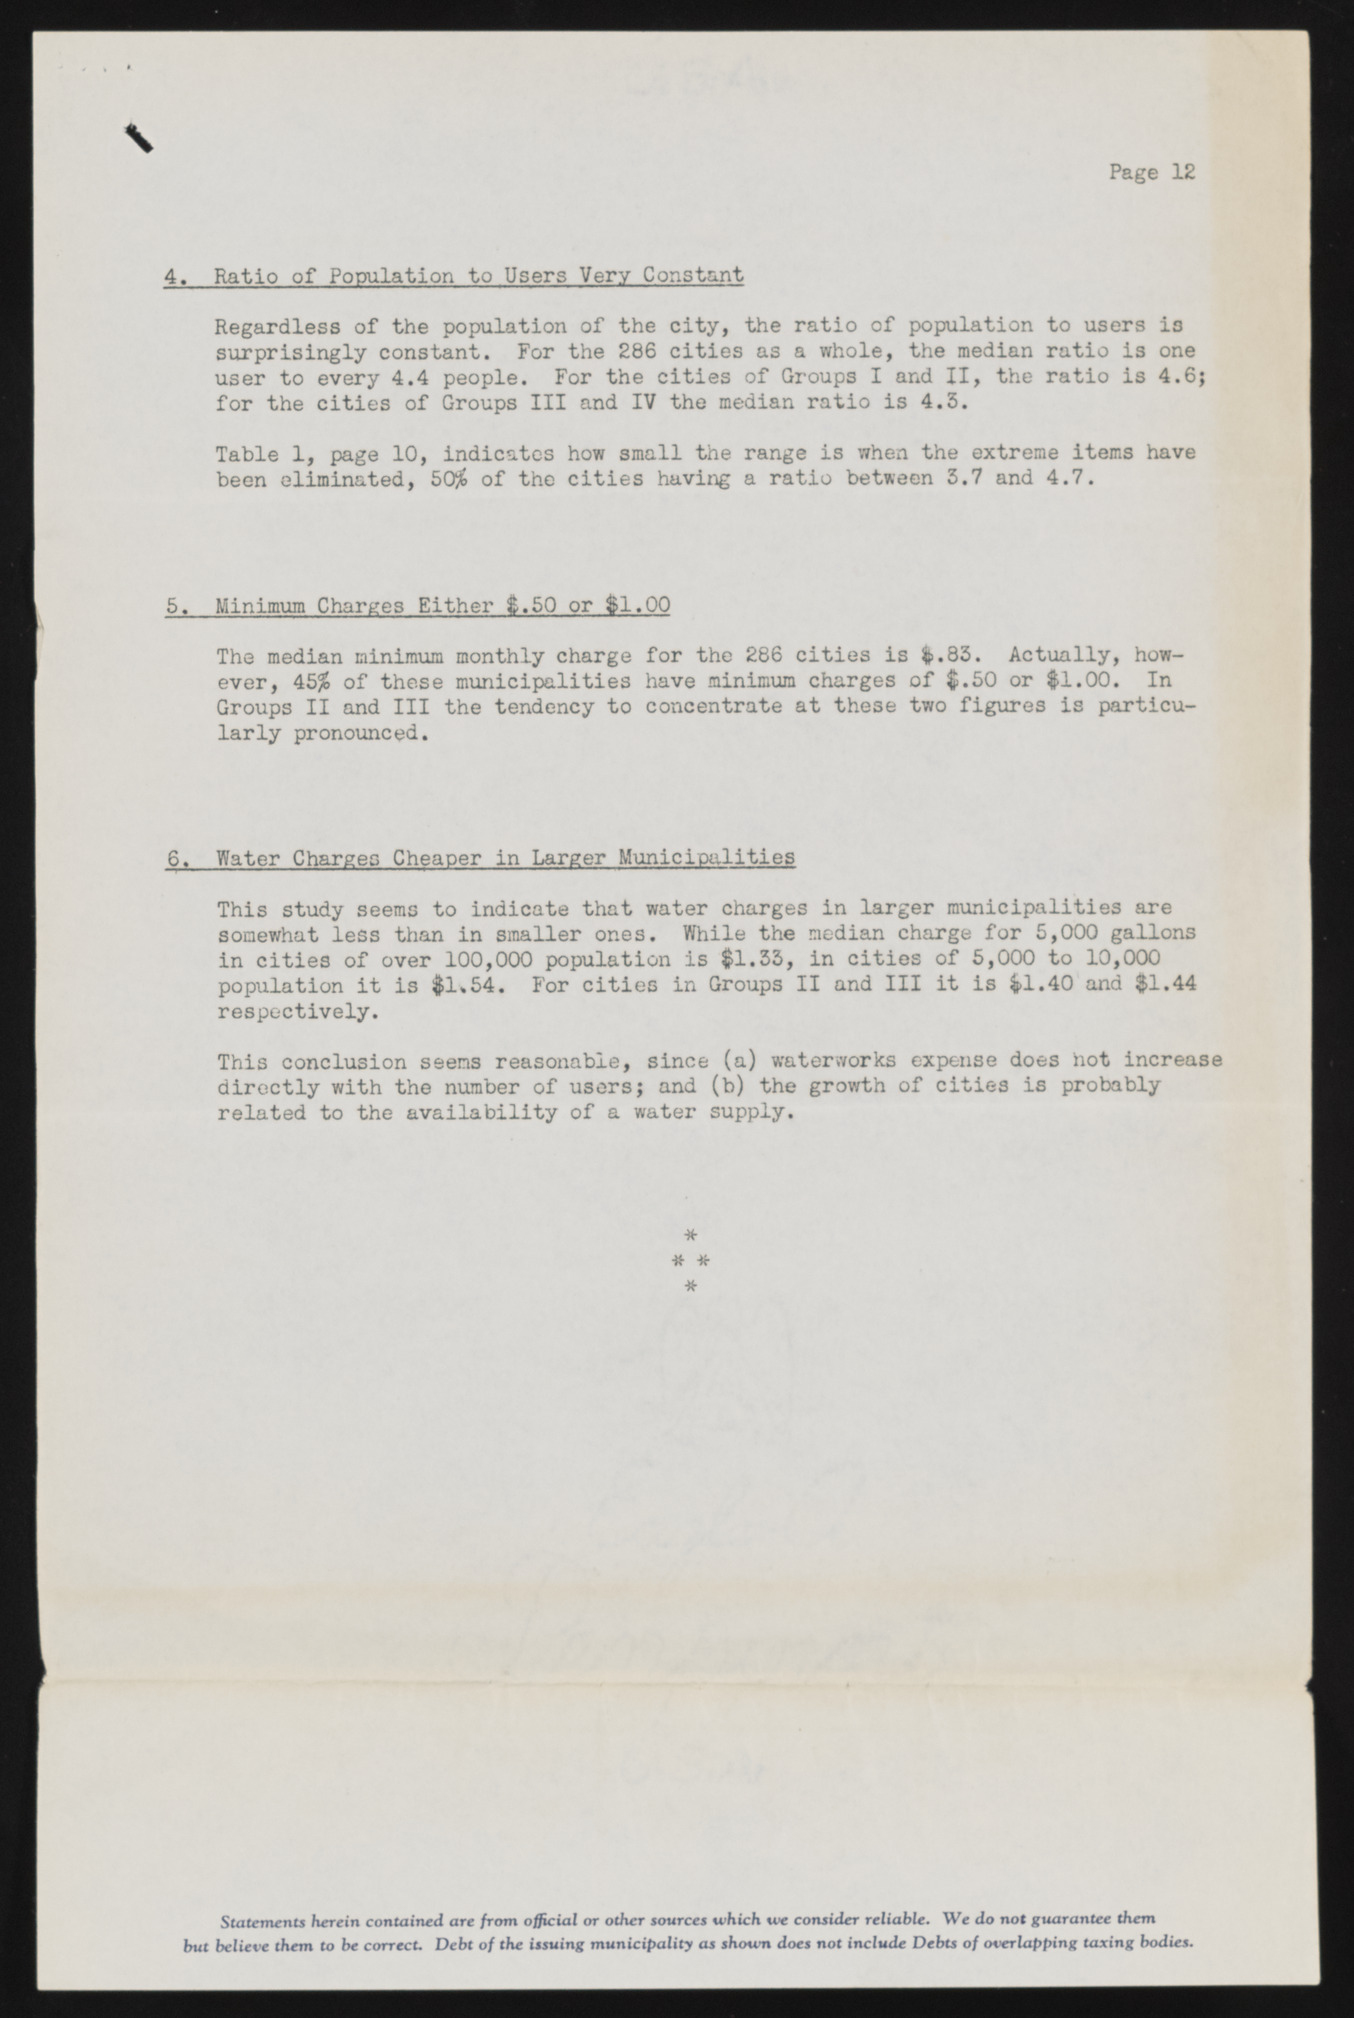
\ Page 12 Regardless of the population of the city, the ratio of population to users is surprisingly constant. For the 286 cities as a whole, the median ratio is one user to every 4.4 people. For the cities of Groups I and II, the ratio is 4.6} for the cities of Groups III and IV the median ratio is 4.3. Table 1, page 10, indicates how small the range is when the extreme items have been eliminated, 50$ of the cities having a ratio between 3.7 and 4.7. 4. Ratio of Population to Users Very Constant 5. Minimum Charges Either $.50 or $1.00 The median minimum monthly charge for the 286 cities is $>.83. Actually, however, 45$ of these municipalities have minimum charges of $.50 or $1.00. In Groups II and III the tendency to concentrate at these two figures is particularly pronounced. 6. Water Charges Cheaper in Larger Municipalities This study seems to indicate that water charges in larger municipalities are somewhat less than in smaller ones. While the median charge for 5,000 gallons in cities of over 100,000 population is $1.33, in cities of 5,000 to 10,000 population it is $1*54. For cities in Groups II and III it is $1.40 and $1.44 respectively. This conclusion seems reasonable, since (a) waterworks expense does hot increase directly with the number of users; and (b) the growth of cities is probably related to the availability of a water supply. * # * * Statements herein contained are from official or other sources which sue consider reliable. We do not guarantee them but believe them to he correct. Debt of the issuing municipality as shown does not include Debts of overlapping taxing bodies.

